Ocean Model Viewer
What Ocean-Model-Viewer is
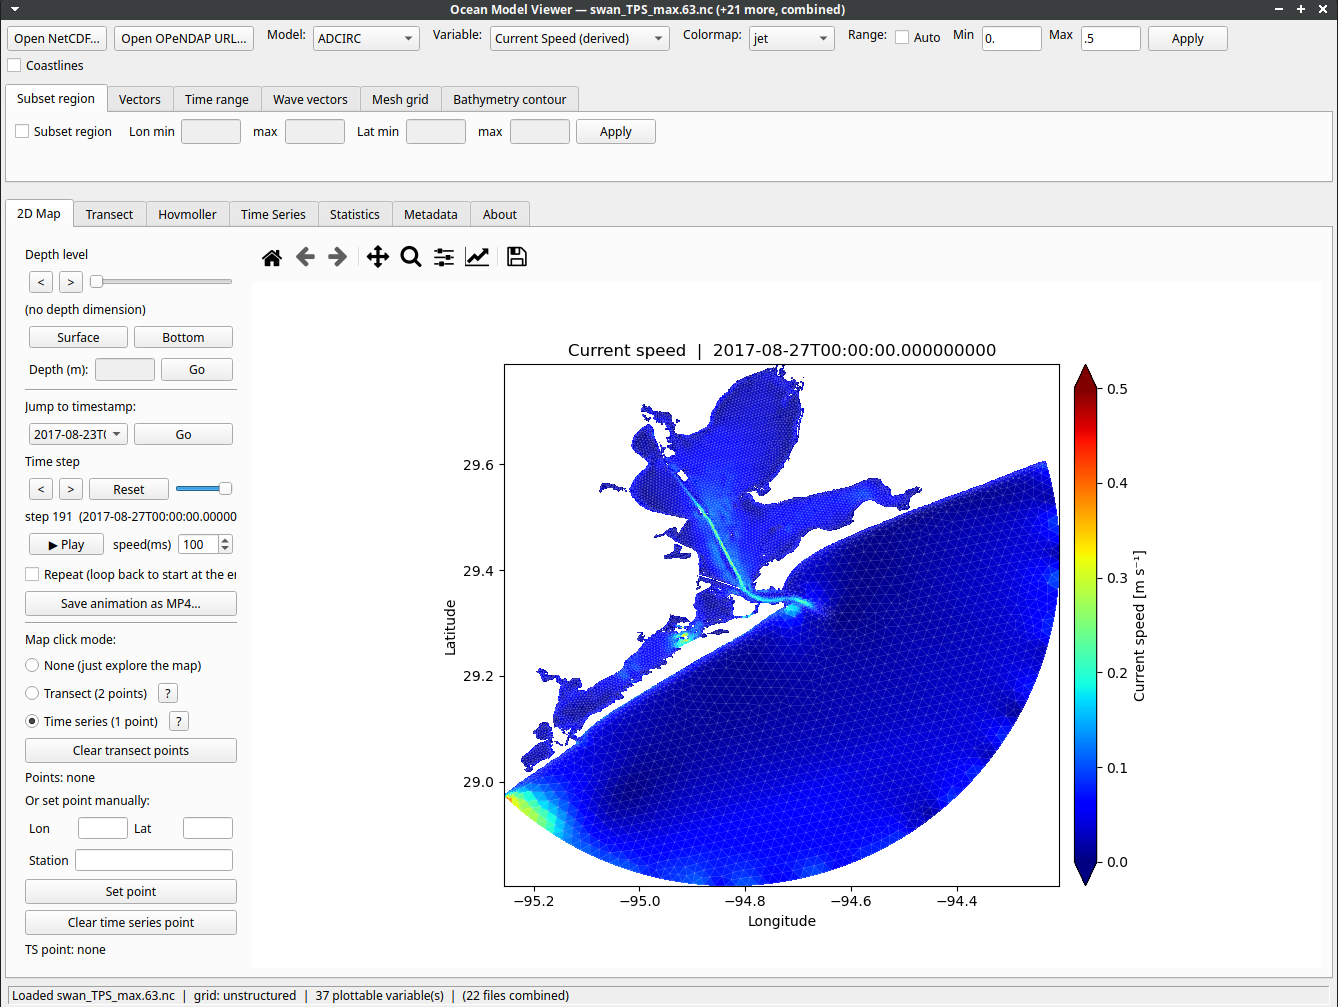
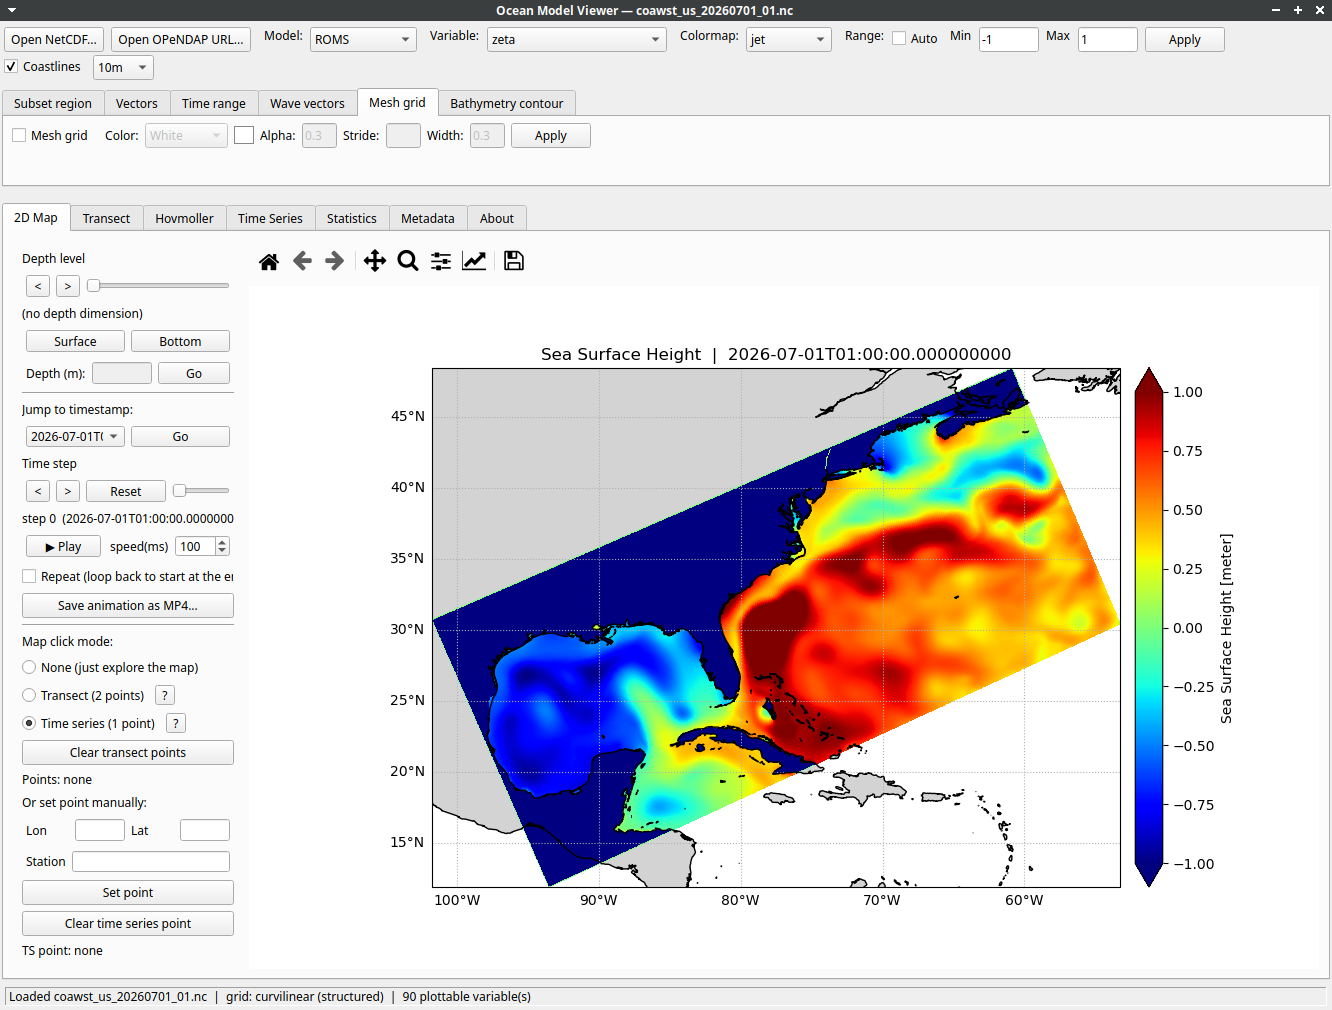
I build lightweight, purpose-fit visualization tools when the standard options fall short. Ocean Model Viewer is one example: a Python-based tool for quickly visualizing ocean model output in NetCDF format. Public-domain tools like ncview and Panoply can’t handle curvilinear or unstructured grids — Ocean Model Viewer visualizes both, and converts vertical coordinates (e.g., sigma) into depth levels, all through a lightweight, easy-to-follow interface.
Compatible model outputs
- ROMS (Regional Ocean Modeling System)
- SCHISM (Semi-implicit Cross-scale Hydroscience Integrated System Model)
- Delft3D (both structured and flexible mesh version)
- SWAN (Simulating Waves Nearshore)
- ADCIRC (Advanced Circulation Model)
- CMEMS (Copernicus’ Ocean Forecast and Analysis, Ocean Hindcast)
What Ocean-Model-Viewer can visualize
- 2D Map view and animation
- Overlaid vectors on top of 2D Map (wind, wave, and current)
- Vertical slicing at a depth of user’s choice
- Save animation in mp4 format.
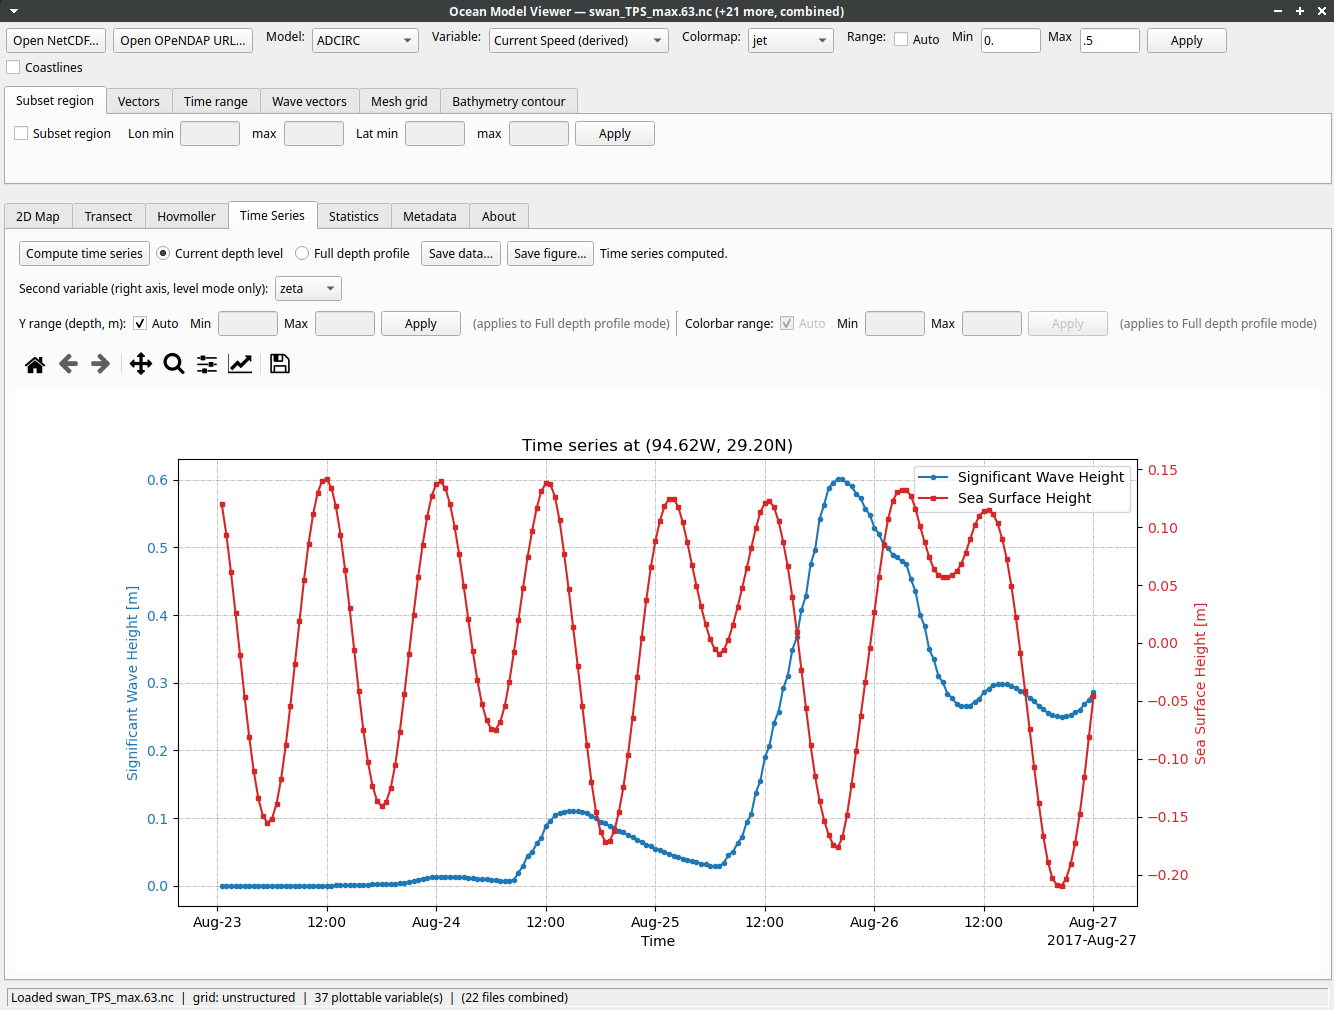
- Time series plot at a point of user selection (both single level and profile)
- Cross-section plot (Users can select the transect of their interest)
- Hovmoller diagram of cross-section (a single level)
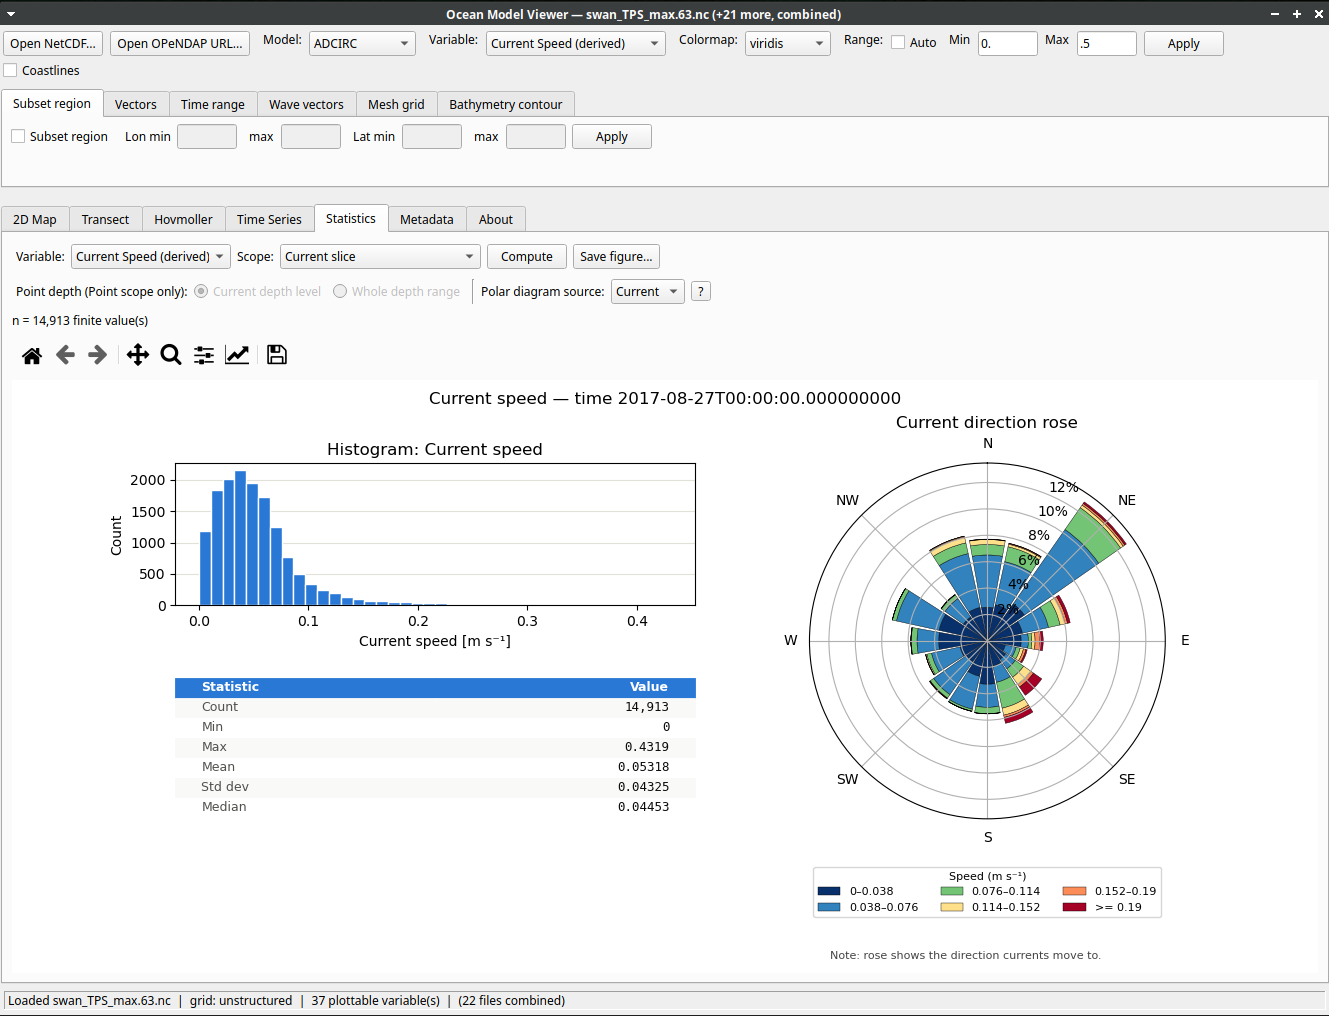
- Statistical analysis (Histogram, mean, min, max, std) and rose plot for vector variables (e.g. Wind, Wave, Current)
Screenshots
Tutorial
- A tutorial video is available here and also on the Resources page.
How to get
- Ocean-Model-Viewer is freely available as an executable file. Details are on my github page