Coupled Wave-Surge Model Inter-comparison: Hurricane Harvey (ADCIRC-SWAN vs. SCHISM-WWM)
Comparing coupled ADCIRC-SWAN and SCHISM-WWM storm surge and wave models for the Galveston, Texas coast, nested from a Gulf of Mexico regional domain, against Hurricane Harvey (2017).
The Challenge
Coupled wave-surge models differ in mesh type, coupling approach, and computational cost, and it’s often unclear which setup best fits a specific coastal application without actually running both against the same storm, the same nesting strategy, and the same observation network.
The Approach
Set up both ADCIRC-SWAN and SCHISM-WWM for the Galveston, Texas coast using a nested-domain approach: running each model first over a Gulf of Mexico regional domain, then nesting a local Galveston-area domain driven by boundary conditions from that Gulf-wide run. Checked every result against the same eight NOAA CO-OPS water-level gauges and the NDBC buoy at 42035.
The Result
At the regional Gulf-of-Mexico scale, SCHISM-WWM matched observed wave heights better than ADCIRC-SWAN and finished in roughly a third of the total compute. At the local Galveston scale, SCHISM-WWM reproduced roughly 70–90% of the observed storm-surge rise at the five open-coast and inlet gauges (correlation 0.68–0.89) and ADCIRC-SWAN roughly 30–45% (correlation 0.57–0.83). Local current speed is only about a third of the observed depth-averaged value: about half on tide-only days, and much less during the storm because the run has no river or rainfall inflow to drive the sustained outflow the current meter recorded. Two bay-interior gauges also don’t respond in the model at all — all documented below as open problems.
Two coupled circulation/wave codes — ADCIRC+SWAN and SCHISM+WWM — solve the same physics on very different meshes (structured-triangle vs. fully unstructured) with different coupling and numerics. Rather than argue the tradeoffs in the abstract, this project runs both, the same way, against a real hurricane: Harvey’s 2017 landfall on the Texas coast.
The comparison uses a nested strategy: a Gulf-of-Mexico-wide regional domain sets the large-scale surge and wave field, and a high-resolution Galveston-area domain nested inside it resolves the bay, the ship channel, and the barrier islands where the observation network actually sits. Both models were carried all the way through both scales, and checked against the same eight CO-OPS water-level stations, NDBC buoy 42035, and the local wave record.
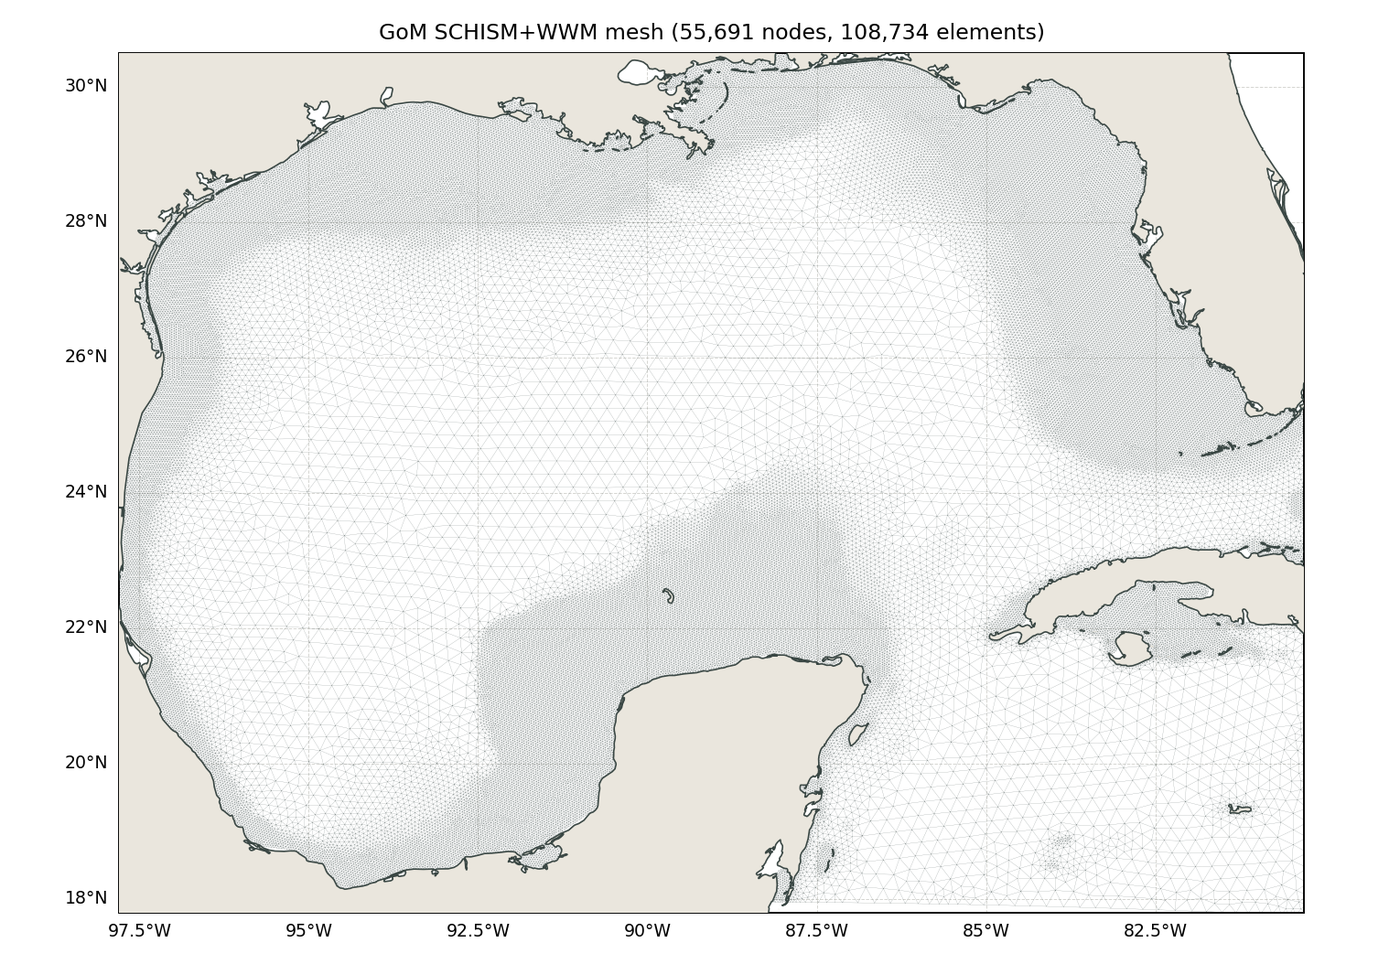 Fig. 1 — The shared Gulf-of-Mexico mesh both models ran on: same triangulation, same 10 NDBC buoys, same storm.
Gulf-of-Mexico scale: waves and cost
Same mesh, same storm, same wind forcing concept (GAHM+ERA5) — the cleanest comparison available between the two systems.
| SCHISM-WWM | ADCIRC-SWAN | |
|---|---|---|
| Mean Hs correlation (10 buoys) | 0.917 | 0.878 |
| Mean Hs RMSE | 0.415 m | 0.446 m |
| Wall-clock time | 142.8 min (24 ranks) | 638.7 min (16 ranks) |
| Total compute (rank-minutes) | 3,427 | 10,219 |
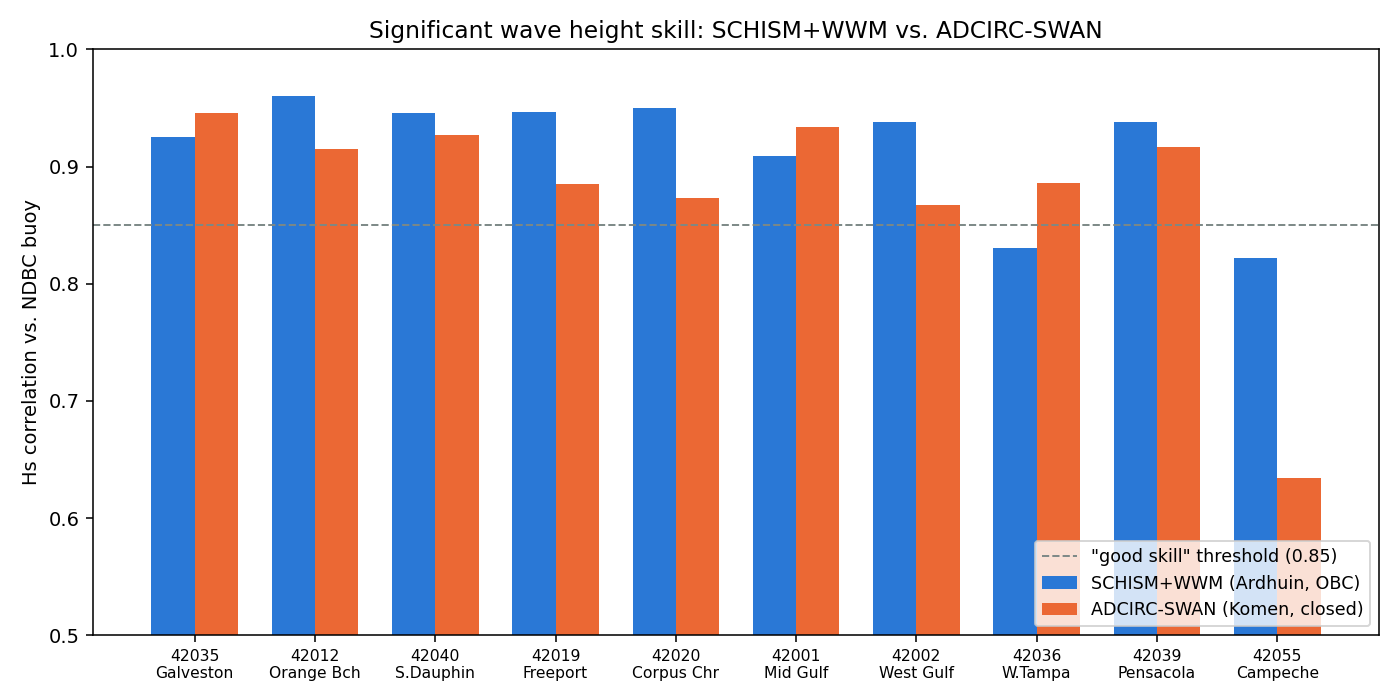 Fig. 2 — Wave-height correlation by buoy station. SCHISM-WWM leads at most stations.
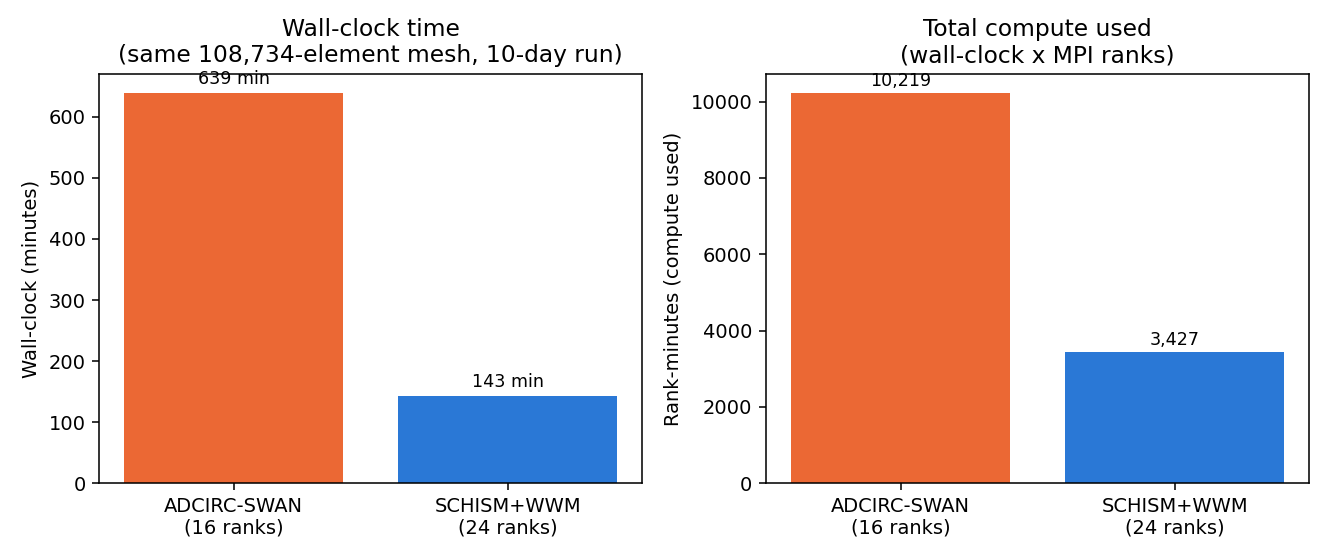 Fig. 3 — Wall-clock time and total compute for the identical 10-day, 108,734-element run. SCHISM-WWM finished about 4.5x faster and used roughly a third of the total compute.
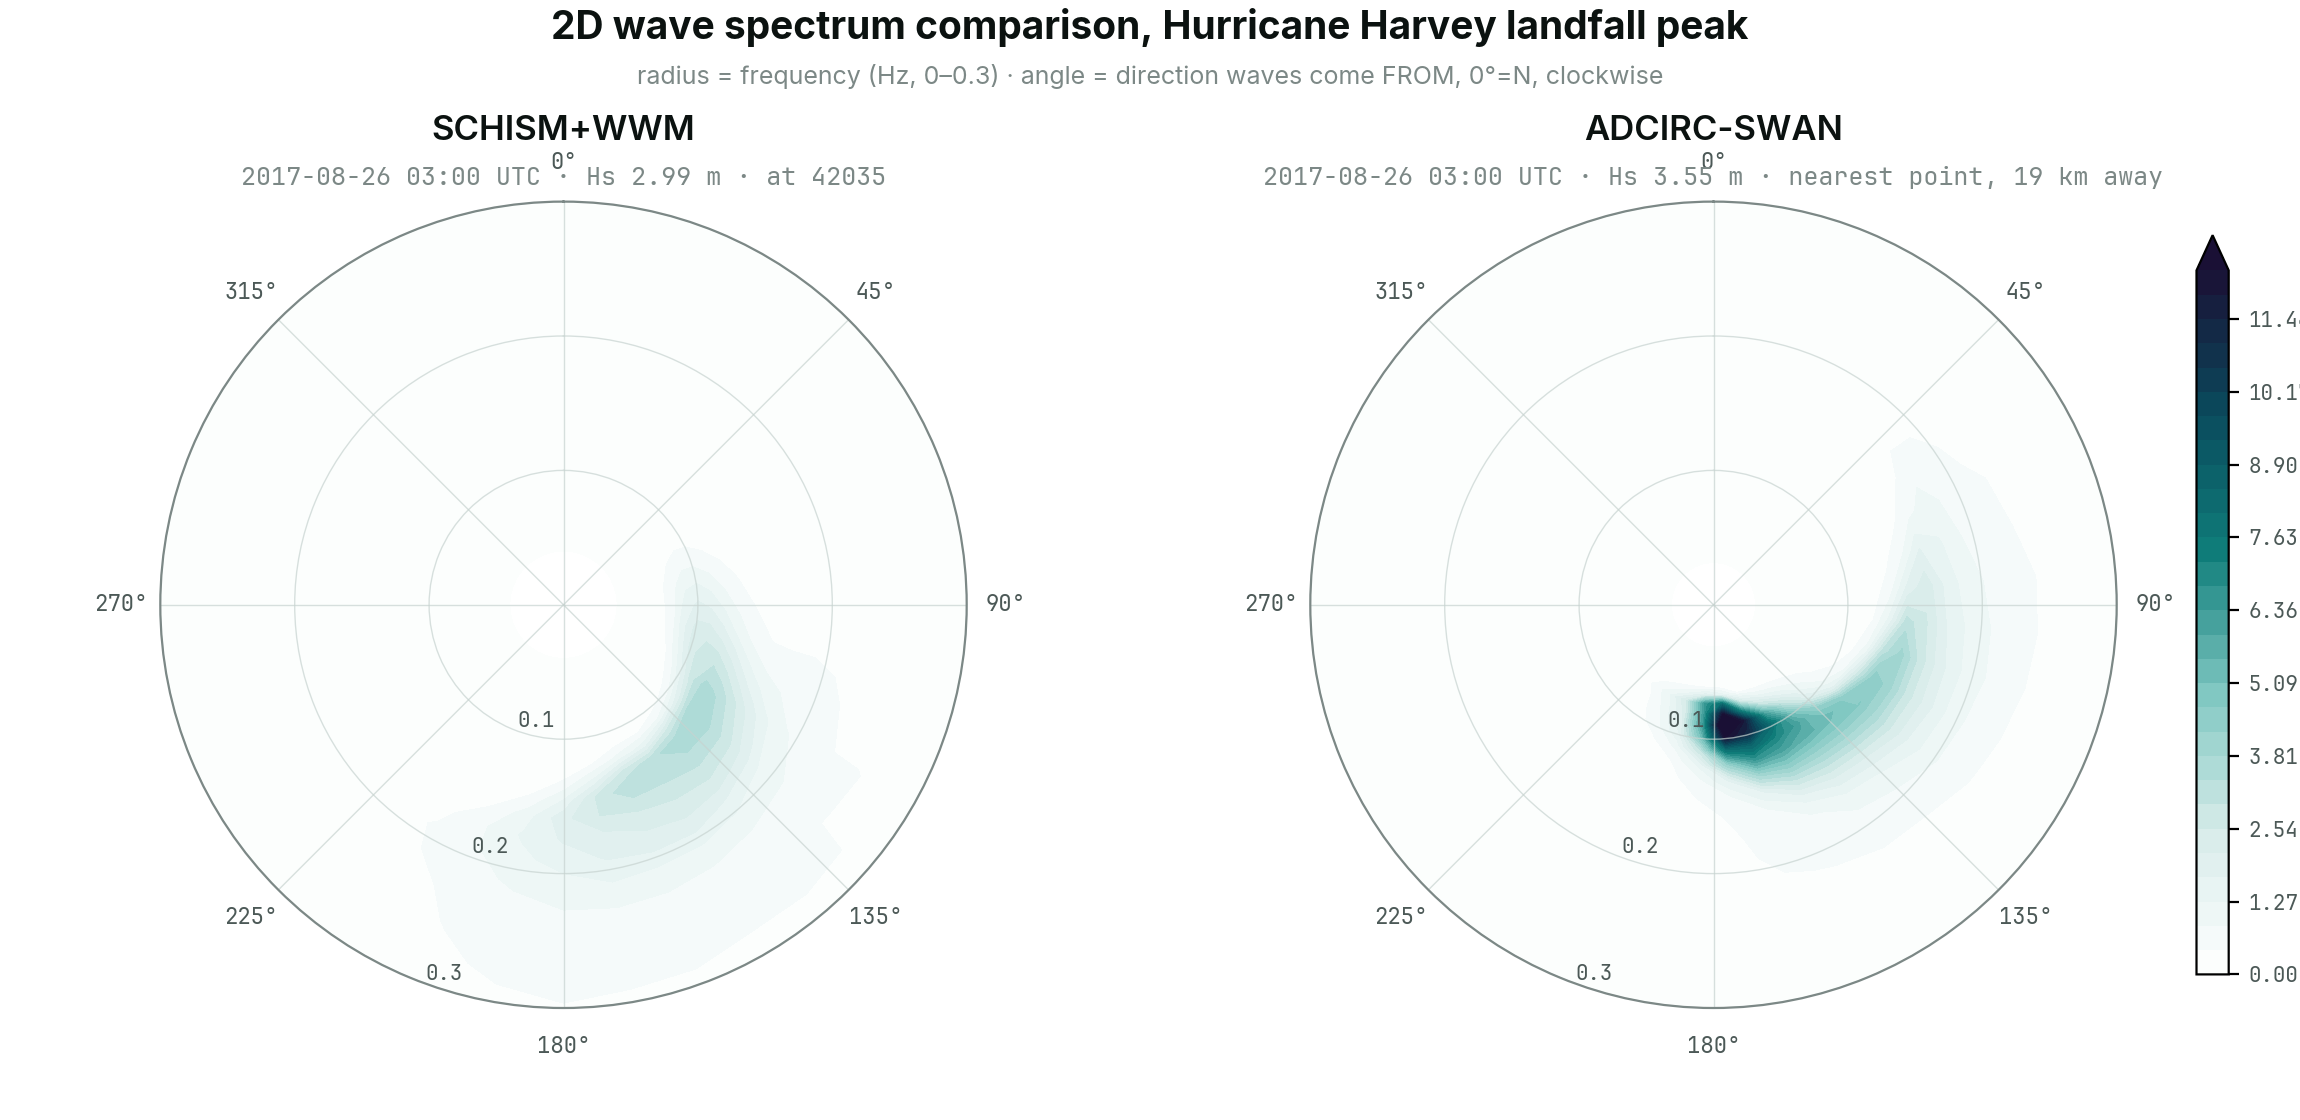
SCHISM-WWM’s edge in wave accuracy isn’t just numerics — it’s traceable to the wind-input physics itself. WWM runs the Ardhuin et al. ST4 source-term package, documented in the wave-modeling literature as a genuine, quantified improvement (roughly 30% RMSE reduction in global validation) over the older Komen-generation physics that SWAN’s closest analogue relies on. That shows up directly in the two models’ 2D wave spectra at the storm’s peak:
Fig. 4 — 2D wave spectrum at Harvey’s landfall peak. SCHISM-WWM (left) produces a broader, more physically realistic spread of energy across direction and frequency; ADCIRC-SWAN (right, nearest SWAN output point, ~19 km from the buoy) is more sharply peaked — the signature of the weaker source-term physics behind it.
Local Galveston scale: wind, wave, current, storm surge
No local-domain ADCIRC-SWAN comparison existed before this project — validating it here, against the same eight CO-OPS gauges and buoy 42035 used for SCHISM, was part of the work. One caveat up front: the local SCHISM-WWM results below all come from the production run on the original (v6) local mesh. The Harvey rerun with the offshore-boundary fix described in the Ike write-up was never completed.
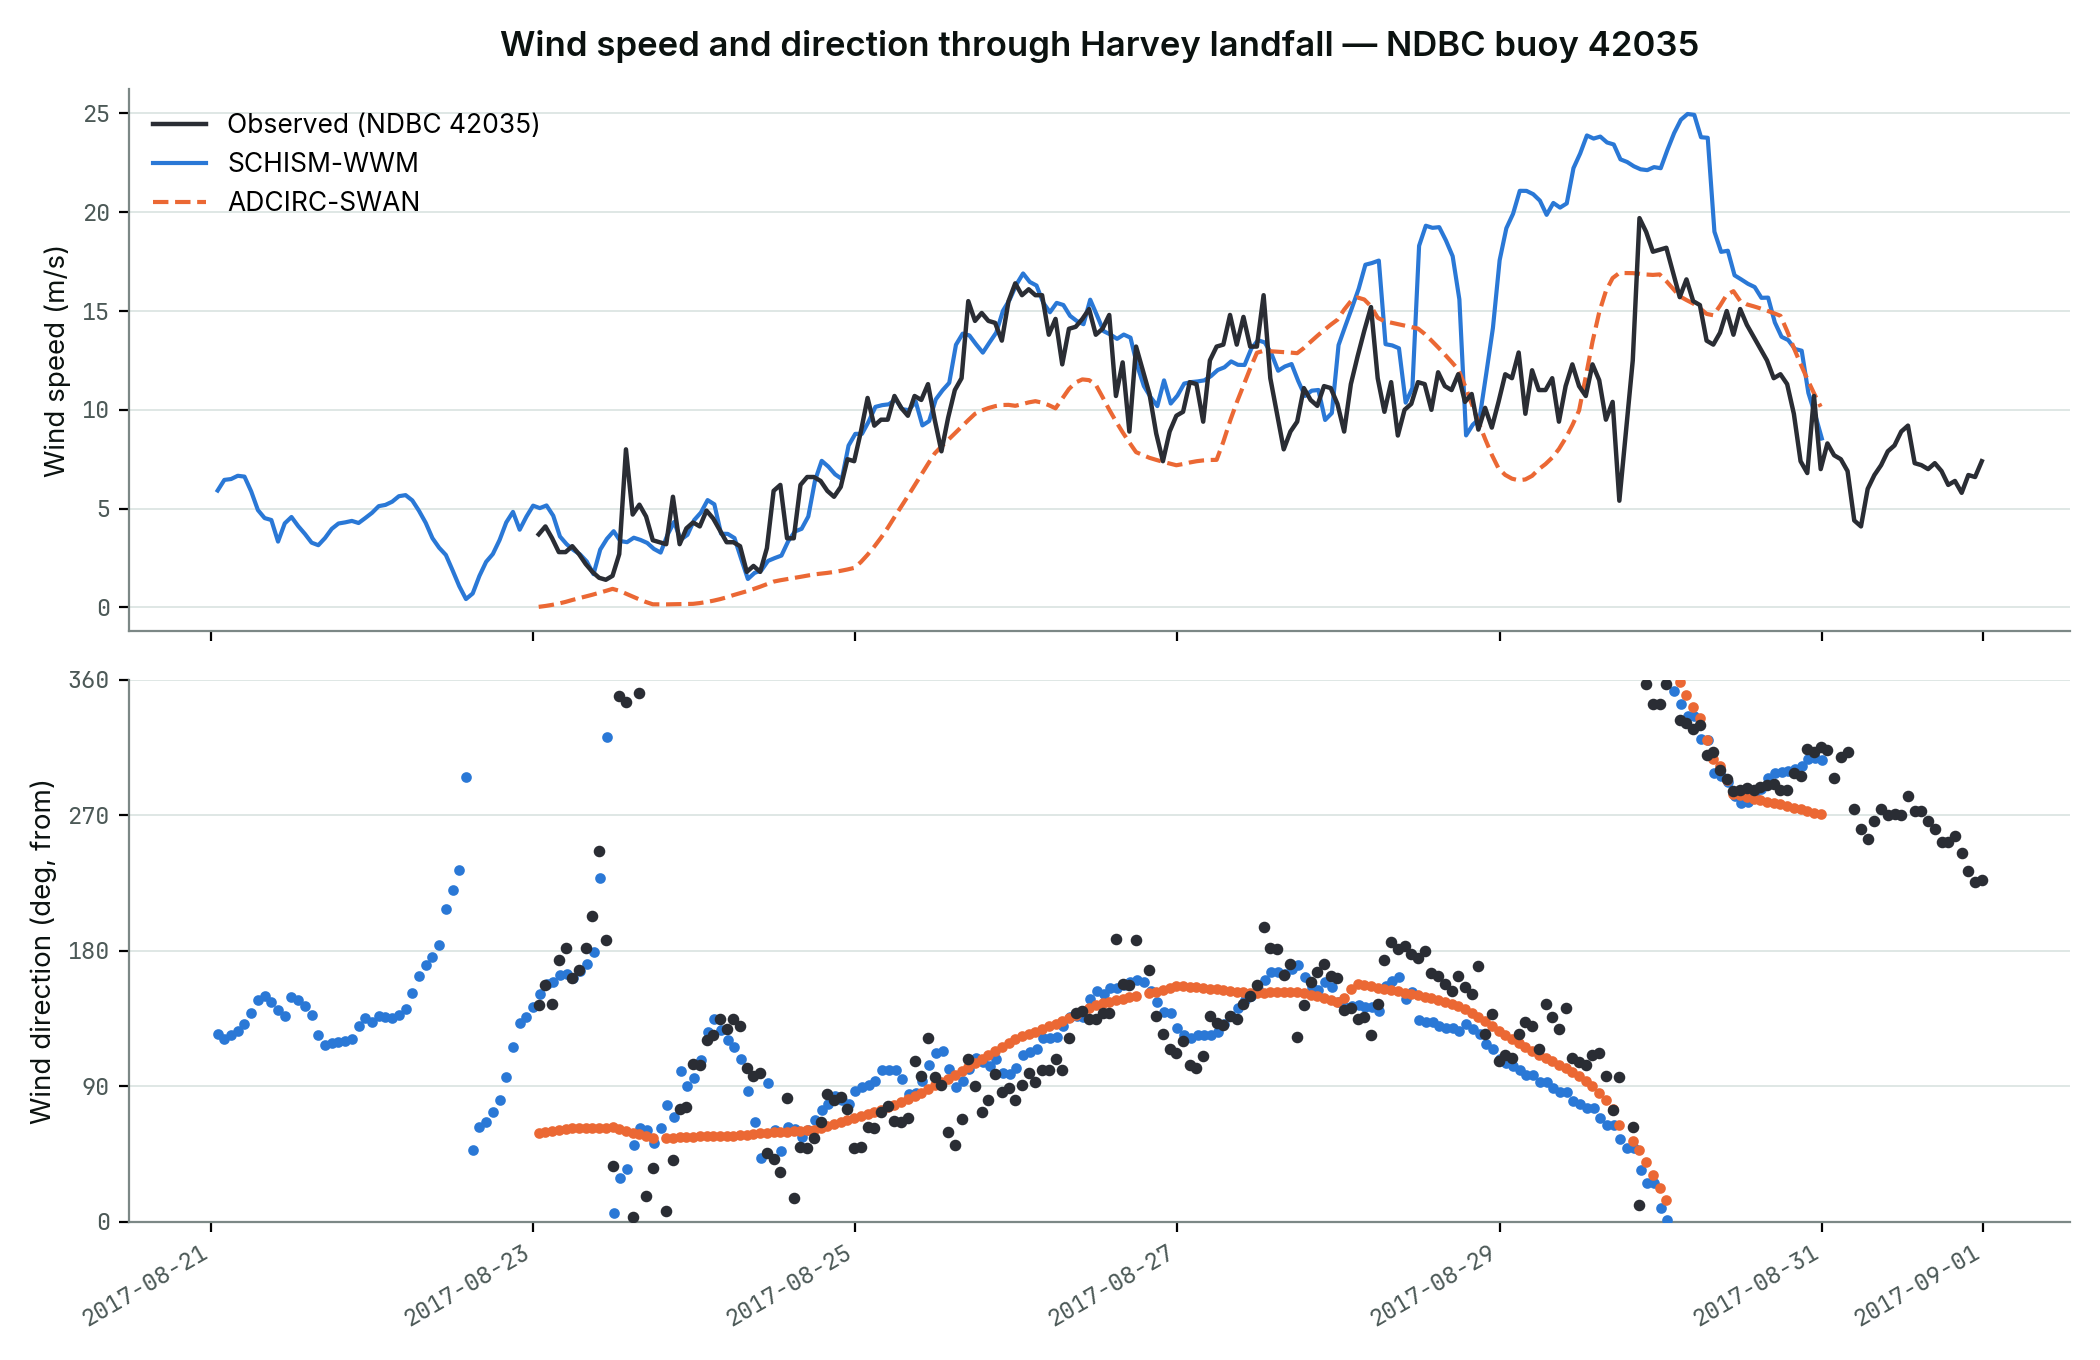 Fig. 5 — Wind speed and direction at 42035 through landfall. Both models track the observed wind speed ramp-up and direction veer closely.
Wave validation
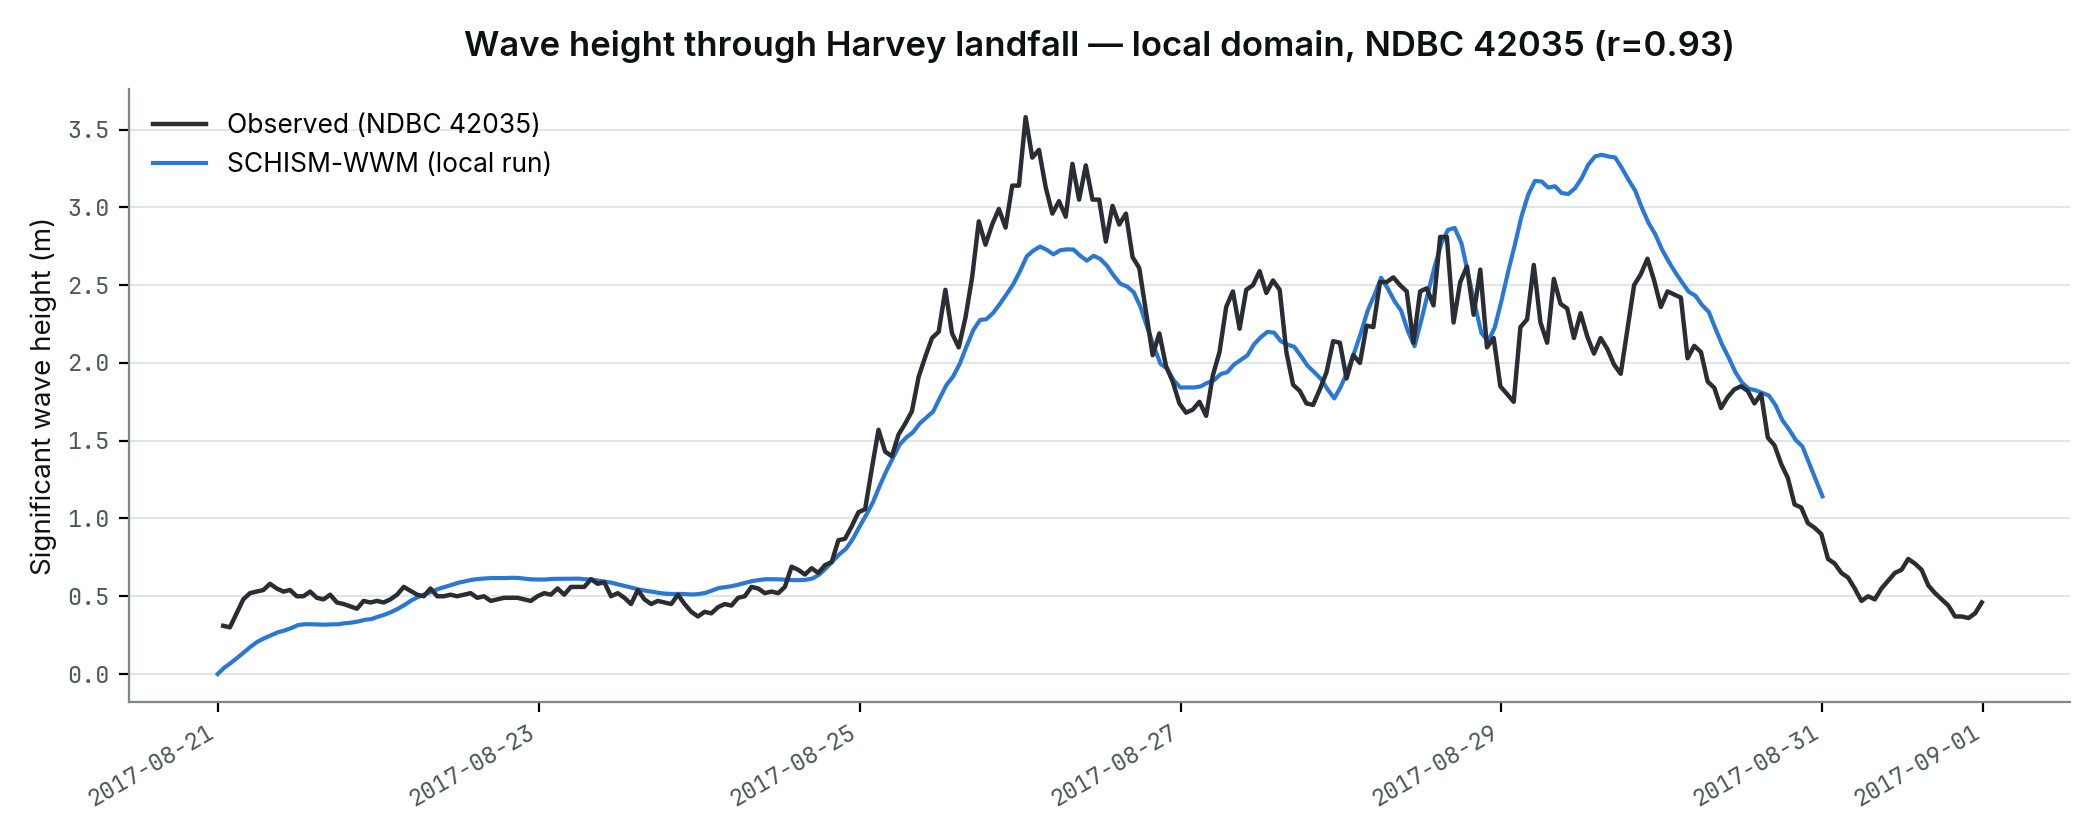 Fig. 6 — Wave height at buoy 42035, SCHISM-WWM’s local (fine-resolution) domain (r=0.93, RMSE 0.37 m, bias +0.03 m) — essentially unbiased, and consistent with the same model’s Gulf-of-Mexico-scale skill above.
Current validation
Real observed current data is rare for a storm this old, but one nearby NOAA PORTS current-meter station — Galveston Bay Entrance Channel — has a continuous record back to 2017, Harvey’s own year, so this is a genuine obs-vs-model check, not a qualitative one. The instrument measures eight depth bins from 3.8 to 10.8 m; because the model run is 2D (one depth-averaged layer), it is compared against the average of all eight bins, not the near-surface bin alone.
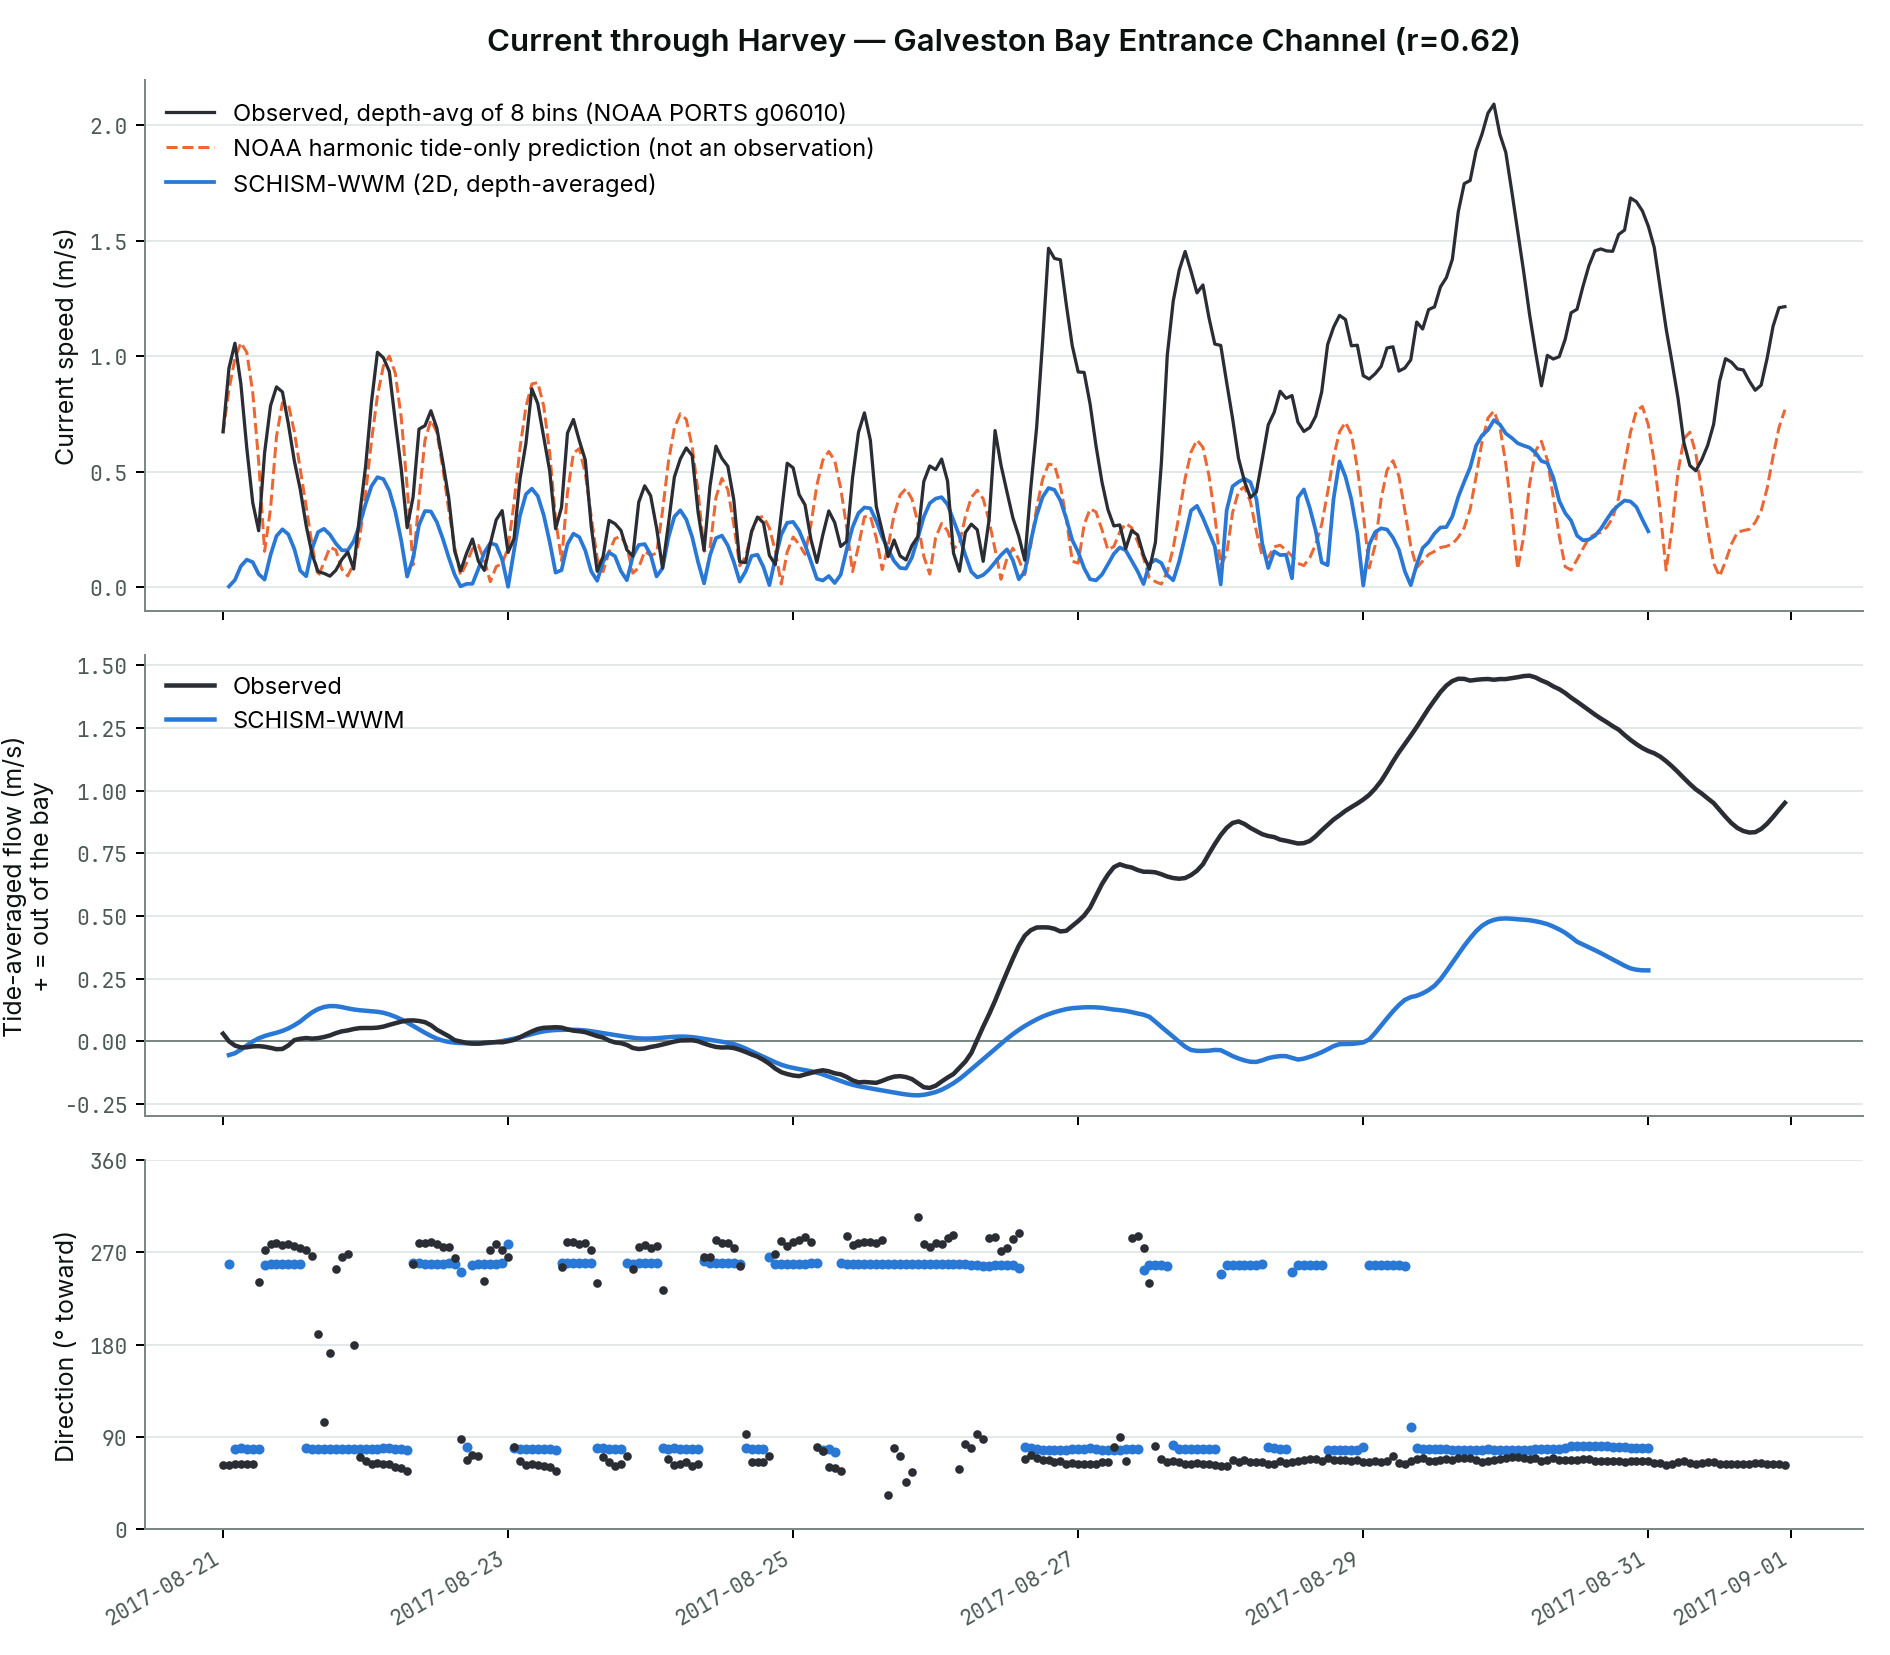 Fig. 7 — Current at the Bay Entrance Channel. Top: speed — observed (depth-average of the meter’s 8 bins), SCHISM-WWM, and NOAA’s harmonic tide-only prediction for the same station (an independent reference for the tidal part of the current, not an observation). Middle: the tide-averaged flow along the channel, positive out of the bay. Bottom: direction. The model gets the ebb/flood direction and timing right, but its speed is too low — mean 0.22 m/s against 0.71 m/s observed (about a third) — and it misses almost all of the sustained outflow that builds after Aug 26.
That gap is a real model deficiency, not a measurement mismatch, and it has two separate parts.
Depth-averaging accounts for only about 10% of it. An earlier draft blamed the gap on comparing a depth-averaged model against a near-surface sensor. Checking that against all eight bins ruled it out: mean speed falls only from 0.79 m/s at 3.8 m to 0.57 m/s at 10.8 m, so the depth-average (0.71 m/s) is barely below the surface reading.
Storm days: the run has no river or rainfall inflow. Averaging out the tides, the observed flow through the entrance is near zero before the storm and then turns into a sustained outflow that builds through Aug 27–31 to about 1.4 m/s — the signature of Harvey’s flood runoff and stored bay water draining out. The tide-only prediction shows how much of that is not tidal: over Aug 25–30 the observed mean speed is 0.91 m/s against 0.30 m/s predicted from the tides alone, three times as much, whereas before the storm the observation and the prediction agree (0.40 vs. 0.38 m/s, r = 0.86). The model, which has no river or rain input, stays near its tide-only level (0.27 m/s) and shows only a small fraction of the extra outflow (peaking near 0.5 m/s in the tide-averaged flow, from surge relaxation alone). I haven’t proven that runoff is the whole story — surge relaxation contributes too — but the timing and size are consistent with it.
Tide-only days: the model is about half as fast. Over Aug 21–24, before any storm effect, the model’s mean speed is 0.19 m/s against 0.40 m/s observed, and 0.38 m/s from NOAA’s tide-only prediction (ratio 0.50, correlation 0.73): the model has the right shape and timing at half the amplitude. Several explanations were ruled out directly. The inlet is not under-resolved — the mesh has edges of roughly 250 m across the entrance channel and about 200 m (down to about 120 m) along the Ship Channel, with a dozen or more nodes across its width at 13.7–14.6 m depth, matching the dredged channel. It is not a spin-up artifact: after the first half-day the model-to-prediction ratio holds steady at 0.4–0.5 through day 3.5. Every deep mesh node near the sensor is equally weak, the model’s own depth-averaged output matches the values plotted, and the water-level tide at the bay gauges matches observations (diurnal and semidiurnal amplitudes within 0.8–1.1x), so the bay is filling and emptying at about the right rate. The model also conserves volume — its inlet flux tracks the bay’s volume change (correlation 0.99). What is left was tested directly, with short reruns of the same setup (Aug 21–25) changing only the smoothing. The Shapiro filter (strength 0.5) and horizontal viscosity used to keep the run stable smooth the velocity field at every step, and relaxing them raises the entrance current. With the Shapiro filter off, the model reaches 0.71 of the predicted speed (0.27 m/s, up from 0.19); with the viscosity off as well, 0.82 (0.31 m/s). Switching instead to SCHISM’s alternative velocity scheme (indvel=1) made things worse, at 0.43. So the smoothing accounts for roughly two-thirds of the shortfall, but relaxing it is not free: the modeled tidal amplitude inside the bay at Pier 21 and the Railroad Bridge rises to 0.32–0.33 m against 0.21–0.23 m observed, further above the observations than the original run’s 0.26–0.28 m, and about a fifth of the current shortfall remains. Those reruns also stopped before the storm arrived, so whether the relaxed settings stay stable through landfall — the reason the smoothing was there — has not been tested. The mesh’s bay is also somewhat smaller than the real one (about 1,250 km², against roughly 1,500 km² commonly cited, a figure I haven’t verified), which would reduce the flow modestly but probably not by half. The same tide-only shortfall (half of NOAA’s predicted speed) appears in the Ike run on a different mesh, which points toward something the two configurations share, such as the smoothing settings, rather than a problem specific to one mesh.
Storm surge
The SCHISM-WWM numbers in this section are taken directly from the final local run’s elevation output at the mesh node nearest each gauge. (An earlier version of this page used a station-output file from a superseded run, made before the run’s surge boundary was regenerated; it understated the modeled surge rise by roughly a factor of ten.) The ADCIRC-SWAN series are the ones extracted for the earlier validation and are compared with SCHISM on correlation and surge rise only — they are referenced to each series’ own pre-storm mean, so their absolute level isn’t comparable — and I haven’t re-verified that run.
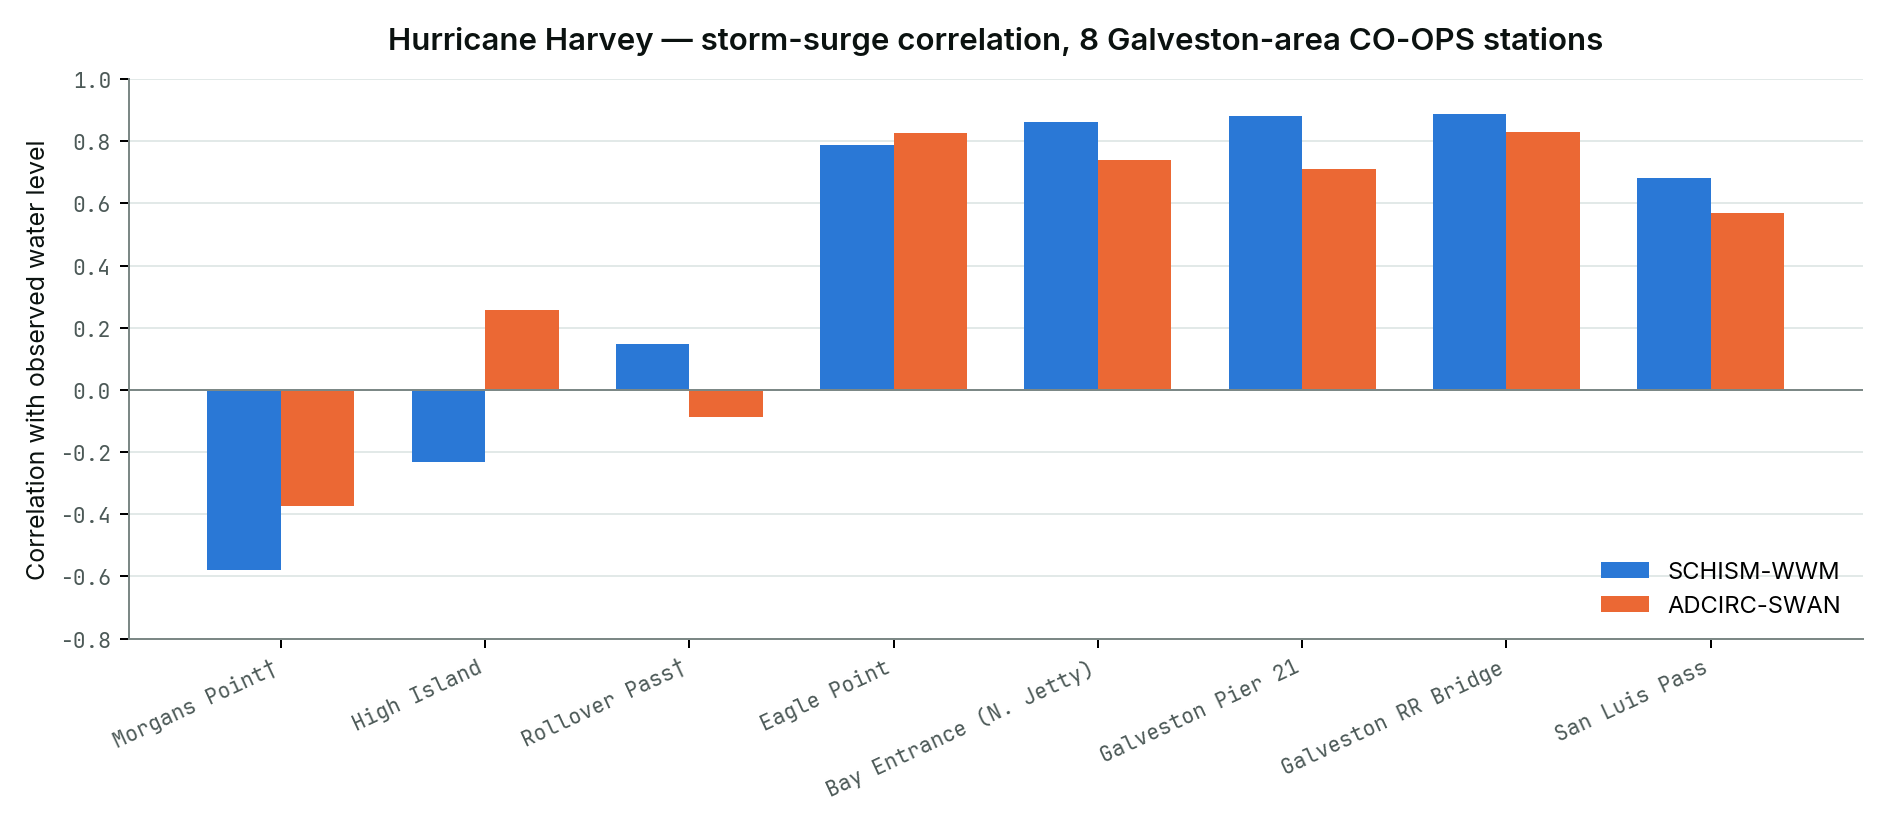 Fig. 8 — Storm-surge correlation at all eight local gauges. At the five open-coast and inlet gauges SCHISM-WWM reaches r = 0.68–0.89 (mean 0.82) against 0.57–0.83 (mean 0.73) for ADCIRC-SWAN. † Morgans Point and Rollover Pass are not a fair test of either model — see below.
Correlation only says the two models get the timing right. The more telling number is how much of the observed surge rise each one produces: the extra water level between the tide-only days (Aug 21–24) and the storm’s multi-day plateau (Aug 25–29):
| Station | Observed rise | SCHISM-WWM rise | ADCIRC-SWAN rise |
|---|---|---|---|
| Eagle Point | +0.75 m | +0.62 m | +0.32 m |
| Bay Entrance (N. Jetty) | +0.52 m | +0.46 m | +0.17 m |
| Galveston Pier 21 | +0.54 m | +0.45 m | +0.17 m |
| Galveston RR Bridge | +0.62 m | +0.53 m | +0.22 m |
| San Luis Pass | +0.65 m | +0.47 m | +0.19 m |
SCHISM-WWM captures about 70–90% of the observed rise at these five gauges; ADCIRC-SWAN about 30–45%. The two models weren’t run with identical boundary treatment, so this shows how these two configurations behaved, not a fundamental property of either code.
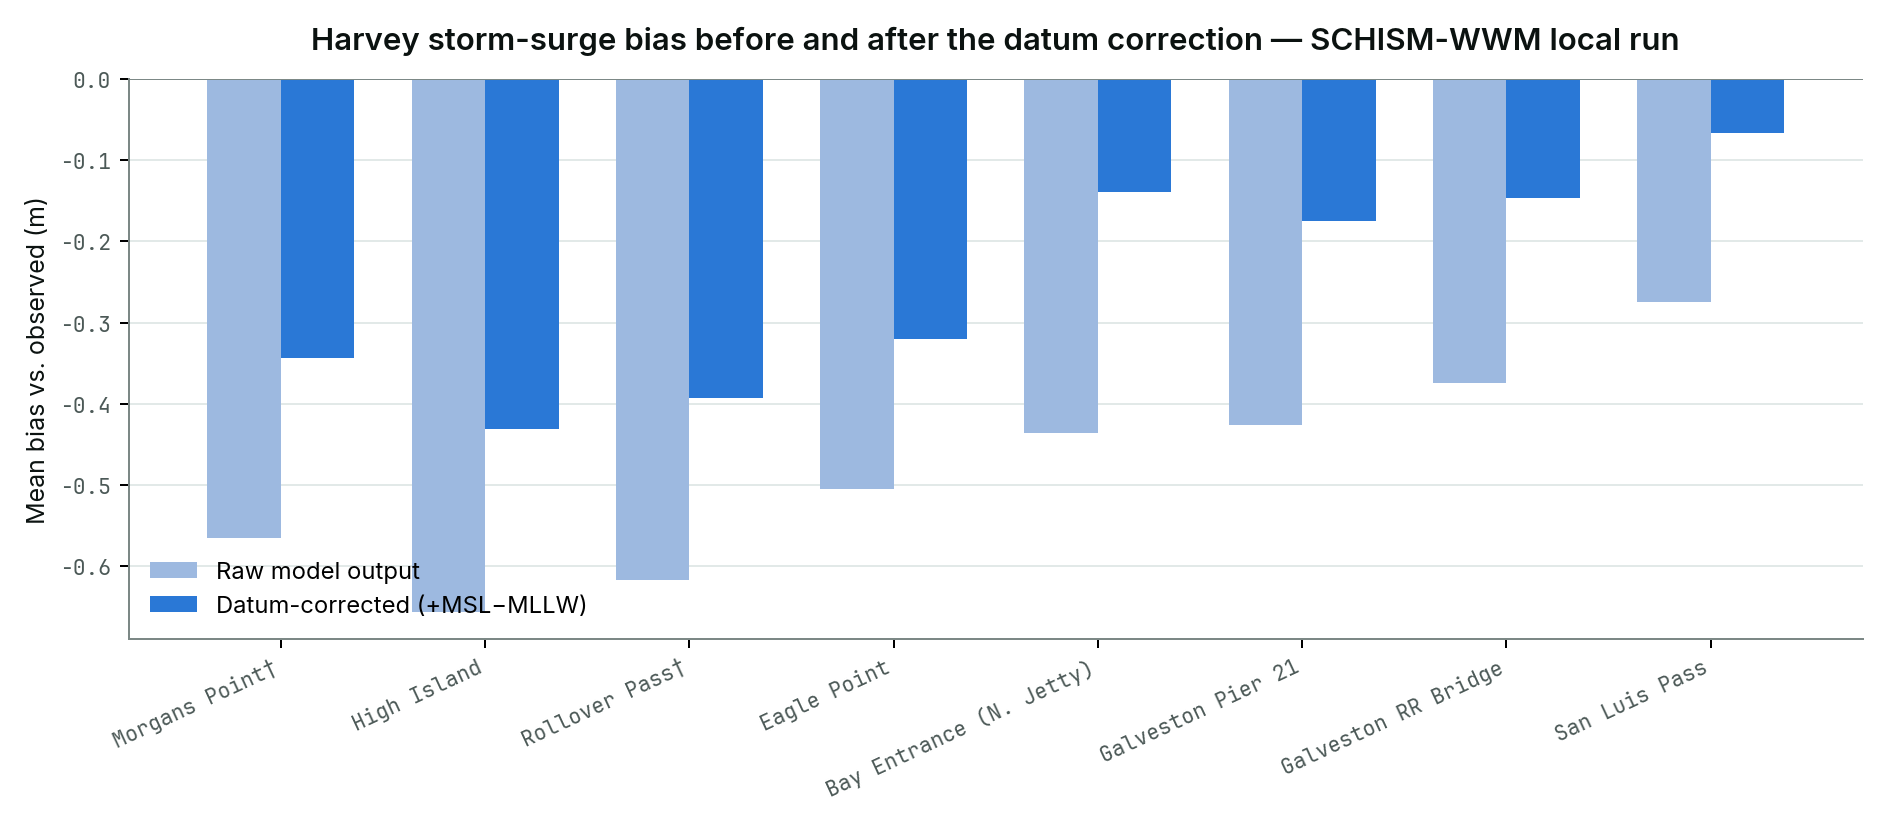 Fig. 9 — Mean bias before and after the datum correction. As on the Ike page, each gauge’s own MSL−MLLW offset (0.18–0.30 m from CO-OPS) is added to the model, correcting for the bathymetry’s MLLW referencing. At the five good gauges, bias improves from −0.28…−0.50 m to −0.07…−0.32 m, and RMSE at Pier 21 and the Bay Entrance halves (0.45 → 0.23 m and 0.47 → 0.23 m).
Some bias remains. Part of it is that observed water sits about 0.15 m above the MSL datum even before the storm — CO-OPS’s monthly means at Pier 21 for 2017 run +0.11 to +0.29 m, reflecting ordinary seasonal and long-term sea-level rise that a model with no steric or sea-level forcing doesn’t have. The Gulf-derived open boundary is also about 0.2 m below zero during the pre-storm days; where that comes from in the parent run hasn’t been diagnosed, so how much of the remaining bias it accounts for is unresolved.
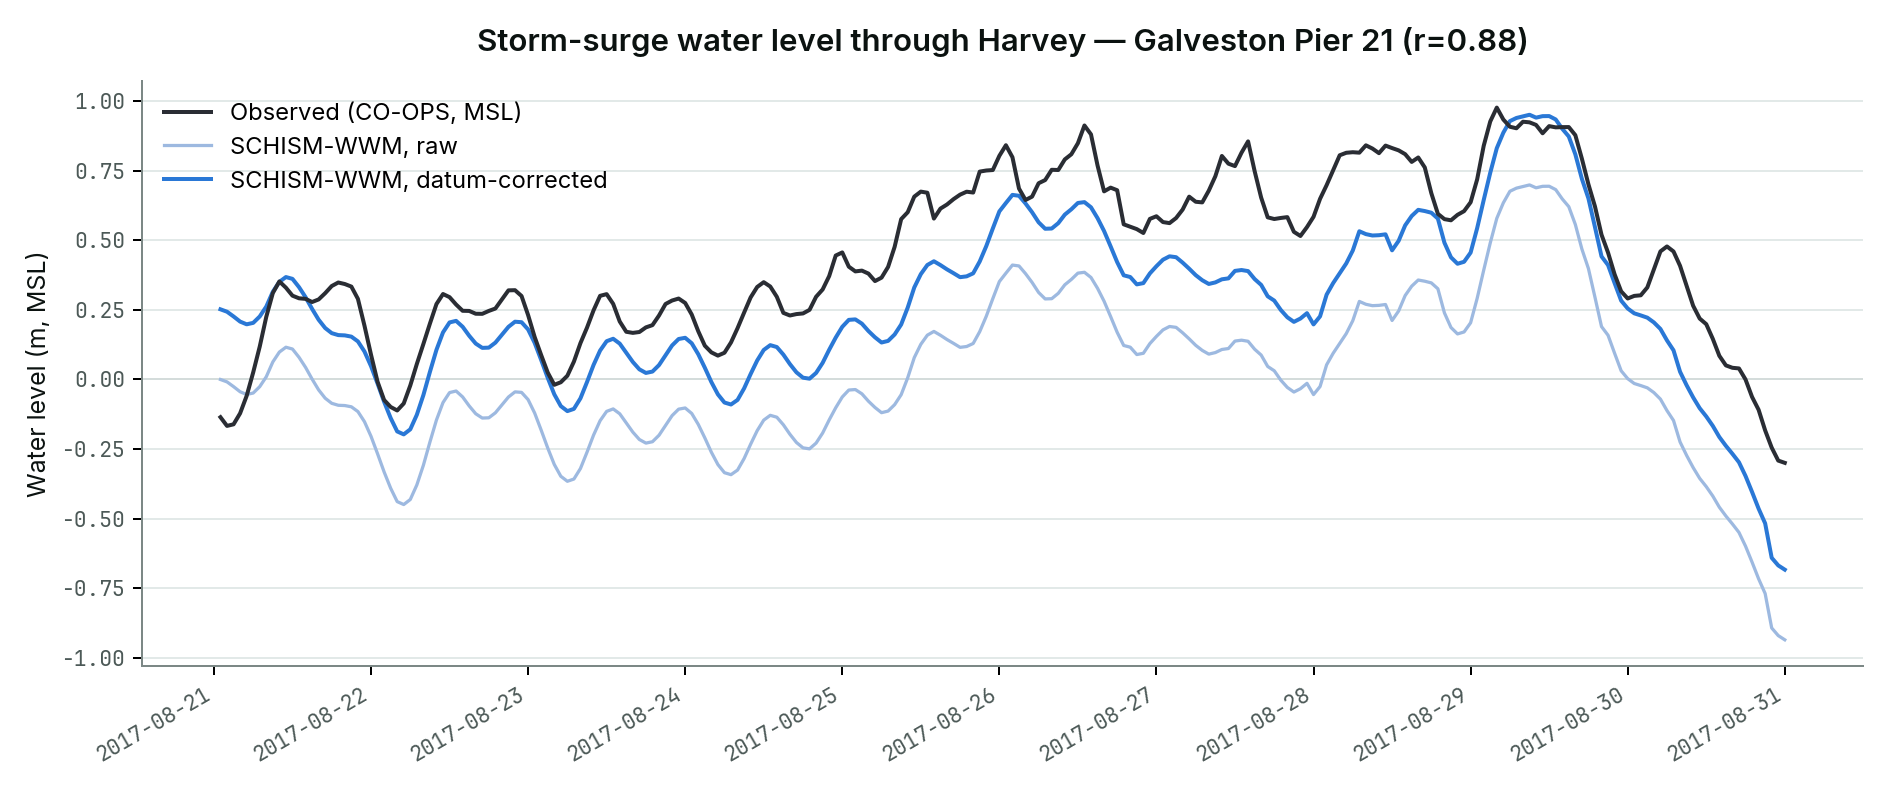 Fig. 10 — Water level at Galveston Pier 21 (r = 0.88), SCHISM-WWM only, raw and datum-corrected. The model follows the tide, the multi-day surge buildup and the Aug 29 peak; it runs about 0.15–0.25 m low through the mid-storm plateau, and falls too far in the last 1.5 days (to about −0.7 m against −0.3 m observed). That final drop comes from the open-boundary forcing, which goes flat at −0.87 m for the last day — most likely an edge effect from filtering the parent-run signal, not real physics — and it inflates the full-window error statistics.
Two gauges are excluded from that reading:
- Morgans Point (at the head of the bay) shows a tidal amplitude of 0.00 m in the model against 0.24 m observed: the nodes at and around the gauge hold an elevation of exactly zero through the whole run, so the station simply isn’t responding. Why hasn’t been diagnosed yet. It’s also where observed water climbs highest (+0.86 m), about 0.3 m more than at the coast, in a way this run cannot produce even in principle: it has no river or rainfall inflow, and Harvey’s flooding delivered enormous runoff to the head of Galveston Bay.
- Rollover Pass shows almost no response (+0.04 m modeled rise against +0.45 m observed), and High Island’s nearest wet mesh node is 4.9 km from the gauge. Both most likely reflect how the mesh represents those locations rather than the physics, though that hasn’t been confirmed.
The honest reading of the local-domain comparison: for the five open-coast and inlet gauges, SCHISM-WWM reproduces most of Harvey’s surge, and ADCIRC-SWAN captures a smaller share of it under the configuration compared here. The remaining problems are specific and tractable — the too-weak inlet currents, the missing river and rainfall inflow, the unresponsive bay-head and Rollover Pass stations, and the tail of the boundary forcing — rather than signs of a general failure of the approach. Wave heights (r = 0.93) are the strongest result.
Models: ADCIRC+SWAN, SCHISM+WWM. Forcing: GAHM-parametric wind fields from HURDAT2 best-track data. Validation: NOAA CO-OPS water-level stations and NDBC buoy 42035.
Uses the same coupled modeling capability described in Hurricane Wave and Storm Surge Modeling. See also the companion write-up on Hurricane Ike, run through the same nested pipeline.