Wave Model Grid Comparison: Hurricane Ike (WW3 to SWAN, Structured vs. Unstructured)
A regional WAVEWATCH III model of the Gulf of Mexico run on a structured grid and on an unstructured mesh, each nested into a local SWAN model of Galveston, for Hurricane Ike (2008) and checked against NDBC buoys — including a diagnosis and partial fix of a Galveston under-prediction that turned out to be a bottom-friction and nest-numerics issue, not a grid-resolution one.
The Challenge
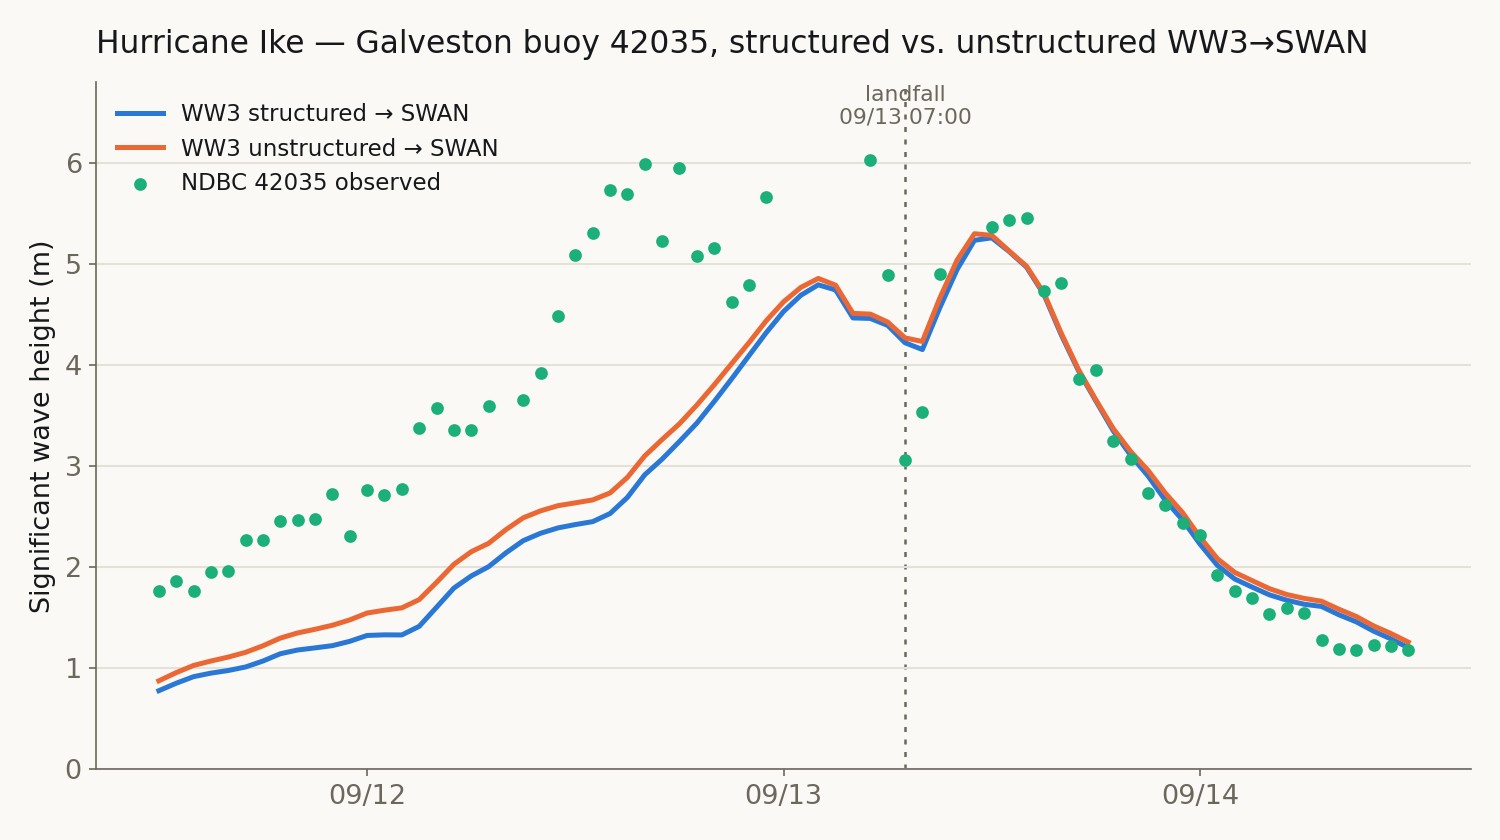
The same nested WW3-to-SWAN workflow validated well for Hurricane Harvey, but for Hurricane Ike — which made landfall almost on top of Galveston rather than 280 km away — the local SWAN nest was under-predicting wave height by more than a meter in the hours before landfall, while WAVEWATCH III on its own matched a coupled SCHISM-WWM hindcast at every other Gulf buoy. That gap needed a real diagnosis, not a parameter guess.
The Approach
Ran WAVEWATCH III over the Gulf of Mexico on a 0.1° structured grid and on a 55,691-node unstructured mesh, both forced by a parametric hurricane vortex (GAHM, fit to the HURDAT2 best track) blended with ERA5, with a 48-hour spin-up so the models weren’t started cold mid-storm. Nested each into SWAN on a 28,834-node Galveston mesh, and isolated the Galveston shortfall by testing candidate causes one at a time: storm surge and currents from a coupled SCHISM run, the SWAN nest’s compute time step, WW3’s swell dissipation, WW3’s bottom friction, and a standalone single-domain SWAN run on the same Gulf mesh with no nest at all.
The Result
Surge/currents and swell dissipation made no difference. Two real, additive causes were found: WW3’s default bottom friction was too strong for this shelf (switching to SWAN’s own default value fixed about 30% of the pre-landfall deficit, and helped every other Gulf buoy too), and the SWAN nest’s default time step was too coarse for its propagation scheme. Combined, Galveston’s RMSE improved from 1.64 m to 1.21–1.33 m and its landfall peak from 4.50 m to 5.26–5.30 m against 6.03 m observed. A standalone single-domain SWAN run reached 0.70 m RMSE at the same buoy under the same wind, showing a real, unexplained WW3-vs-SWAN physics difference remains — documented rather than chased further. Both fixes are now the pipeline default for this storm.
The companion Harvey comparison validated this nested WW3-to-SWAN workflow cleanly, but Harvey made landfall about 280 km from Galveston. Hurricane Ike (2008) made landfall almost on top of it — 29.3°N 94.7°W, a Category 2 with 95 kt winds and a 950 mb central pressure, on 13 September at 07:00 UTC. That difference turned out to matter: the local SWAN nest was under-predicting wave height at Galveston by more than a meter in the hours before landfall, even though WAVEWATCH III (WW3) on its own matched a coupled SCHISM-WWM hindcast of the same storm at every other Gulf buoy. Rather than accept that or tune a parameter until the number looked better, this project isolates what was actually wrong.
The setup mirrors the Harvey comparison: a regional WAVEWATCH III model of the Gulf of Mexico, run once on a structured grid and once on an unstructured mesh, each nested into a local SWAN model of Galveston through 2D boundary spectra at 149 points. Both start 48 hours before the scoring window — Ike was already a mature storm when the window opens, and buoys were already reading several meters of sea, so starting the models from zero at that moment would have understated them for no physical reason. The Python workflow is the same one described under Regional and Coastal Wave Modeling.
Finding what was actually wrong
A real diagnosis means ruling candidates out, not just trying things until a number improves. Each of the following was tested in isolation, holding everything else fixed:
| Candidate cause | Test | Result |
|---|---|---|
| Storm surge / currents | Forced the SWAN nest with water level and currents from a coupled SCHISM run | No effect — surge at the buoy was only −0.5 to +0.2 m before landfall |
| SWAN nest time step | 60-minute vs. 20-minute compute step (same output interval) | Recovered the landfall peak (4.50 → 5.62 m) but not the pre-landfall build-up |
| WW3 swell dissipation | Reduced SWELLF from the coded default toward zero | Barely moved Galveston, made every other Gulf buoy worse — rejected |
| WW3 bottom friction | Switched WW3’s GAMMA from its coded default (−0.067, also what the SCHISM-WWM hindcast uses) to SWAN’s own default (−0.038) | Fixed about 30% of the pre-landfall deficit, and was neutral-to-better at all 8 other Gulf buoys |
| Mesh resolution | Ran a standalone SWAN model of the whole Gulf — no WW3 stage, no nest boundary — on the same fine mesh WW3’s unstructured run uses | Got Galveston to 0.70 m RMSE, far better than the nested chain even with both fixes above |
That last result is the important negative one: WW3 on the identical fine mesh still only reached 1.21 m RMSE at Galveston, so the gap isn’t about grid resolution. It’s a real difference between WW3’s and SWAN’s wave physics at this location that the two fixes above only partly close.
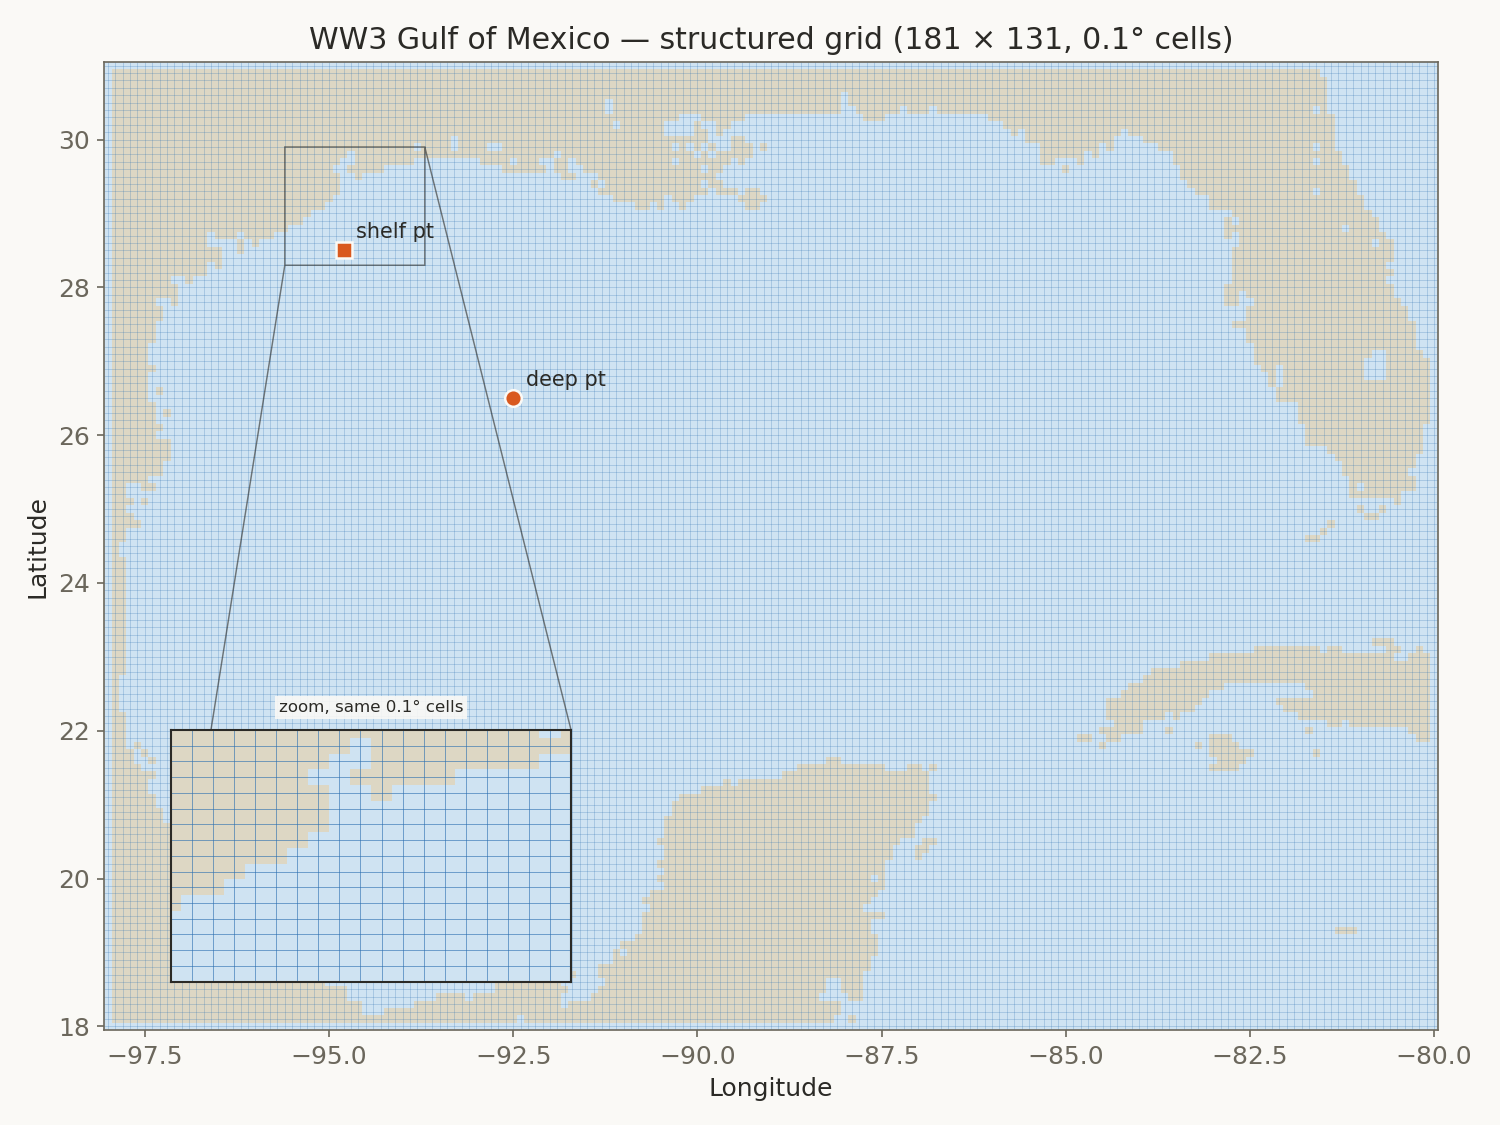 Fig. 1 — The structured WW3 grid, drawn as its actual cell edges.
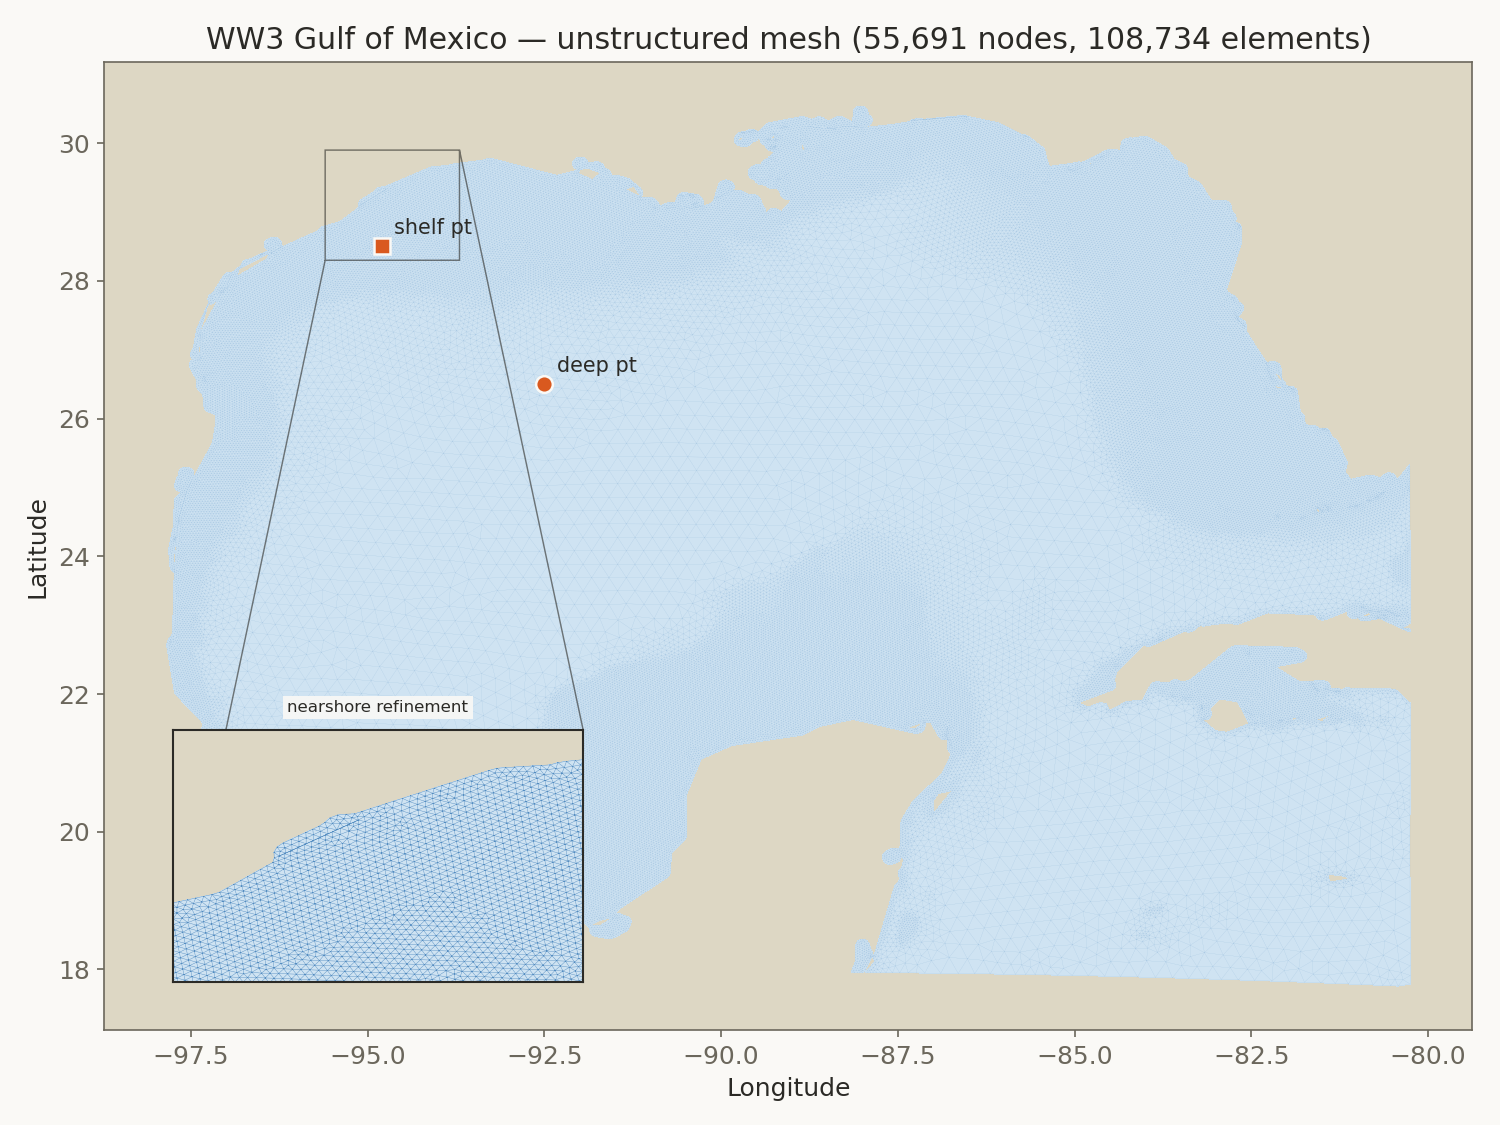 Fig. 2 — The unstructured WW3 mesh, drawn as its actual triangles.
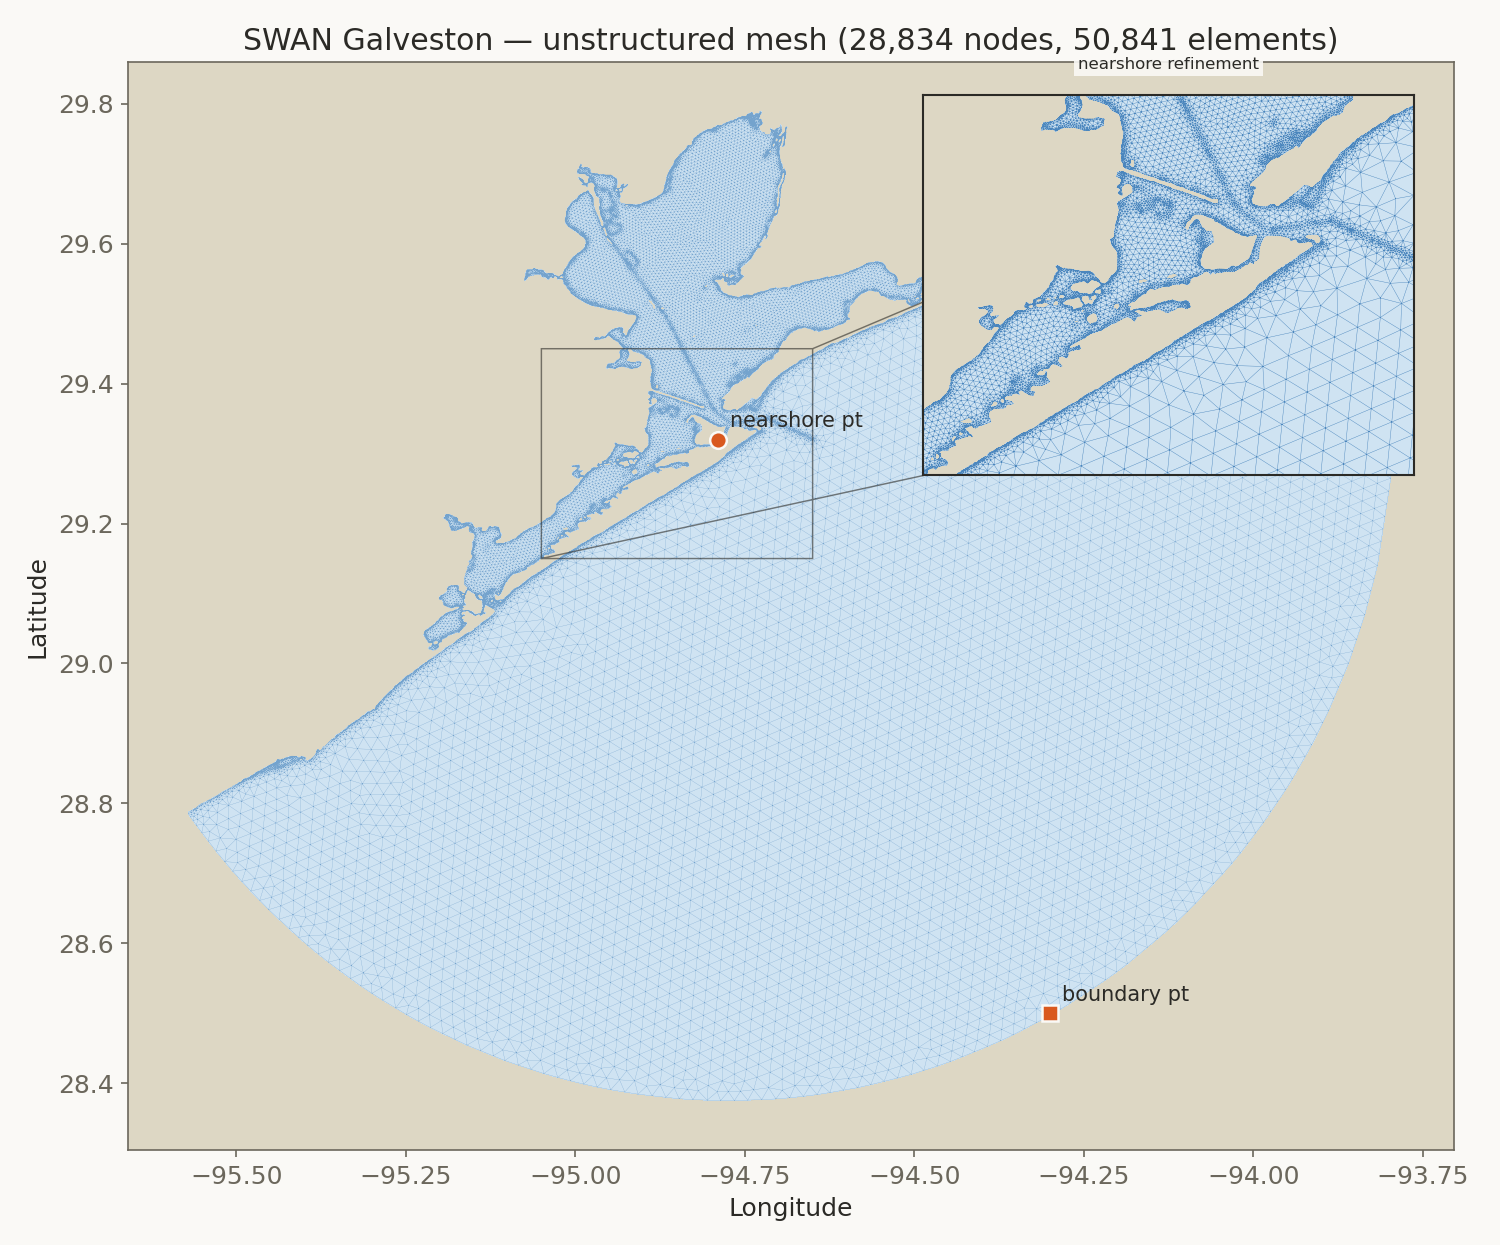 Fig. 3 — The SWAN Galveston nest, the same mesh for both WW3 runs.
What the comparison shows, with both fixes applied
Peak significant wave height at four locations, structured vs. unstructured WW3:
| Location | Structured (m) | Unstructured (m) | Difference |
|---|---|---|---|
| Deep water (92.5°W, 26.5°N) | 11.87 | 12.21 | +2.9% |
| Continental shelf (94.5°W, 28.5°N) | 8.11 | 8.25 | +1.8% |
| SWAN open boundary | 4.13 | 4.31 | +4.6% |
| Galveston harbor entrance | 0.95 | 0.98 | +2.3% |
Against the buoys, wave height (Hs) for the two grids:
| Buoy | Structured: corr / RMSE / bias | Unstructured: corr / RMSE / bias |
|---|---|---|
| 42001 Mid Gulf | 0.90 / 1.70 m / +0.66 m | 0.90 / 2.24 m / +1.19 m |
| 42019 Freeport | 0.89 / 0.89 m / +0.58 m | 0.90 / 0.97 m / +0.73 m |
| 42035 Galveston | 0.75 / 1.33 m / −0.88 m | 0.78 / 1.21 m / −0.76 m |
The structured WW3 run took 116 minutes and the unstructured run 329 minutes, 2.8 times longer, for a modest accuracy trade rather than a clear win either way — the unstructured mesh is closer at Galveston but worse at Mid Gulf.
Things worth knowing
- A wind-forcing bug found first. Before any of the above, the parametric vortex (GAHM) was found to be overestimating peak wind by up to 25% near the core, because a Holland-B safety cap tuned for a weak, decaying storm (Harvey’s stalled phase) didn’t bind the way it was meant to for an intense, deep-pressure storm like Ike. Fixed by fitting the profile shape per quadrant to Ike’s own reported wind radii instead of one storm-wide value.
- A negative result is still a result. Ruling out surge, currents, and swell dissipation — and confirming the gap survives on an identical fine mesh — is what turned “Galveston looks wrong” into two applied fixes plus an honestly documented remainder, instead of a guess.
- The fixes are additive but not complete. Each helped in isolation by more than it did once combined through the full nested chain; the nest’s own numerical behavior evidently caps how much of the upstream improvement survives.
- Everywhere else, WW3 matches a coupled hindcast. Pooled across 9 Gulf NDBC buoys, this pipeline’s wave-height RMSE (0.98 m) is as good as or better than a coupled SCHISM-WWM hindcast of the same storm (1.04 m) — Galveston is the one location where it still trails.
The full report
The interactive report has hourly time series of wave height, period, direction and wind at four locations and three buoys, the full friction/time-step diagnosis, and bias/RMSE/correlation for every combination: open the full report.