Coupled Wave-Surge Model Validation: Hurricane Ike (SCHISM-WWM)
A nested Gulf-of-Mexico-to-Galveston SCHISM-WWM hindcast of Hurricane Ike (2008): wave, wind, current, and datum-corrected storm-surge validation at Gulf buoys and Galveston gauges, a wind-forcing bug whose fix repaired the storm’s structure but not its intensity, and an offshore-boundary fix that recovered lost wave energy.
The Challenge
Ike was a much larger, more intense storm than Harvey, and reusing wind-forcing and boundary settings tuned for Harvey without re-checking them against a storm of a very different character risked quietly wrong results rather than an obvious crash.
The Approach
Ran the same nested-domain strategy used for Harvey — a Gulf-of-Mexico regional SCHISM-WWM hindcast feeding a high-resolution local Galveston domain — against Hurricane Ike, and checked every stage against eight Gulf NDBC buoys, NDBC buoy 42035 and the local CO-OPS water-level network. Later relaunched both the local domain and, separately, the Gulf-of-Mexico parent domain with an improved wind blend and rescored each against the same observations. ADCIRC-SWAN is not included here: that companion run has not yet completed successfully for Ike.
The Result
Found a real wind-forcing bug (a safety cap tuned for Harvey applied to a very different storm), then, separately, integrated a better GAHM+ERA5 wind blend shared with this project’s SWAN/WW3 workflows and relaunched first the local Galveston domain, then the Gulf-of-Mexico parent domain, with it. The new wind cuts peak-wind RMSE by about 40% at buoy 42035 (53 → 34 m/s vs. 27.9 m/s observed) and by about the same at the nearest Gulf buoy, 42001 (peak 52 → 35 m/s vs. 30 m/s observed); every other Gulf buoy is essentially unchanged, since the refit only bites near the storm core. Local wave height still correlates well with observations (r=0.89), but storm surge got worse, not better: with the old, overly strong wind the model reached 88% of the recorded peak at Galveston Pier 21; with the corrected, weaker wind it reaches 66%, and every one of five gauges moved further from its observed peak. The old wind’s overestimate had been silently compensating for a separate surge shortfall — fixing one bug exposed another. In deep water the better wind helped only partly: Hs at 42001 fell from 40% too high to 30% too high despite the local wind’s peak dropping by a third, and 42002’s waves, whose local wind barely changed, stayed just as high. The 2D barotropic model cannot reproduce the observed deep-water current at 42002 either way. Tidal current at the Galveston Bay Entrance is still only about half of NOAA’s predicted speed — the same shortfall found for Harvey, on a different mesh.
Hurricane Ike made landfall near Galveston in September 2008 — a much larger, more intense storm than Harvey (2017), and a useful stress test for a modeling pipeline originally built and tuned around Harvey’s very different wind field. This write-up covers a SCHISM-WWM-only nested hindcast of Ike, run through the same Gulf-of-Mexico-to-Galveston pipeline as the companion Harvey inter-comparison. ADCIRC-SWAN isn’t part of this one: that Ike setup hasn’t yet completed a successful run.
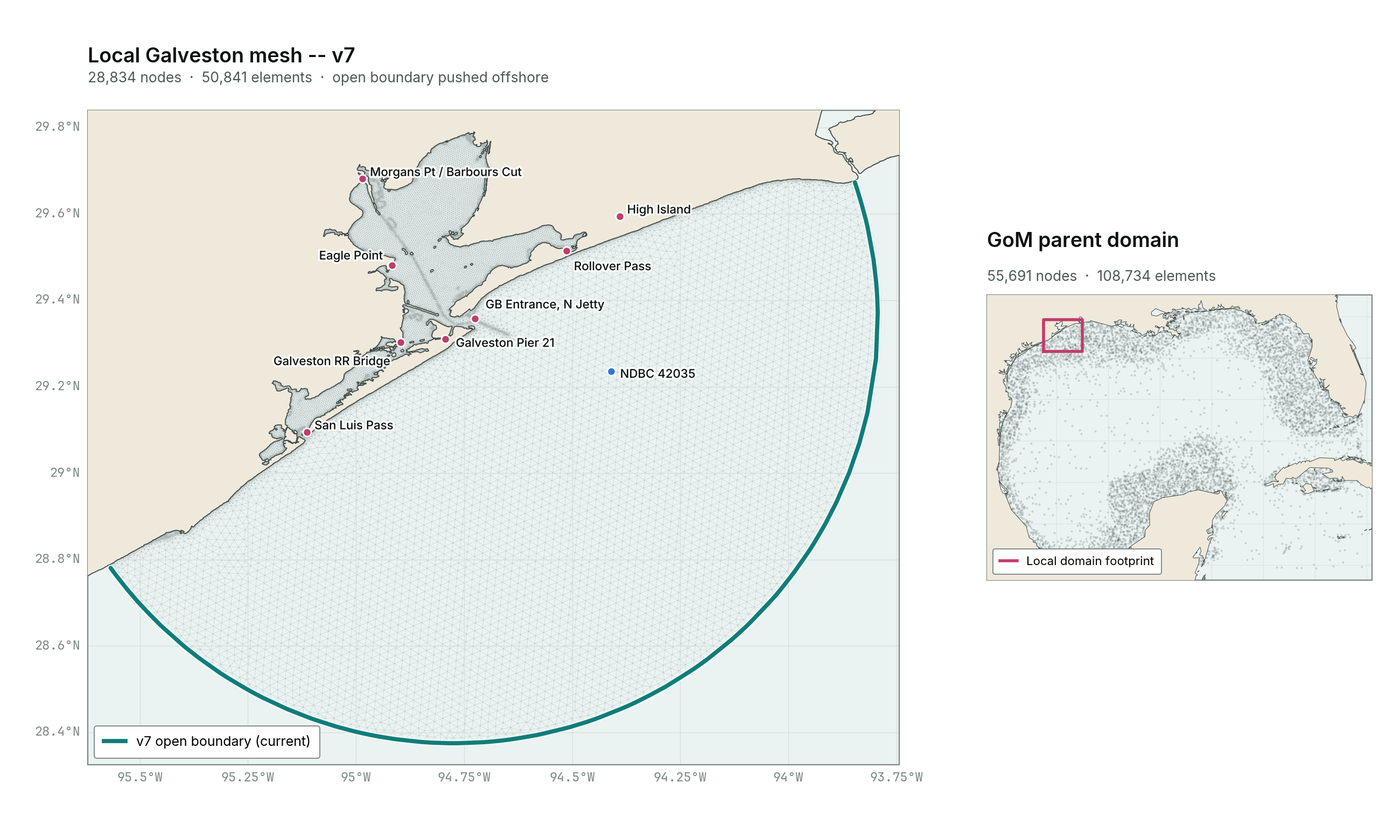
Fig. 1 — The nested domain structure: a local, high-resolution Galveston mesh sitting inside the same Gulf-of-Mexico parent mesh used for Harvey.
A wind-forcing bug: structure fixed, intensity still too high
The Gulf-of-Mexico run surfaced a real wind-forcing bug: the GAHM vortex model’s radius-of-maximum-winds fit was being clamped by a safety cap tuned for Harvey’s weak, broad, post-landfall-stall wind field — the wrong cap for Ike, a much larger and more intense storm, which drove modeled wind at buoy 42035 to about 51 m/s at closest approach against ~28 m/s observed, and left no lull as the eye passed.
The fix makes the cap intensity-aware: when HURDAT2 reports both r50 and r64 wind radii for a quadrant (real evidence of organized hurricane-force structure, which Harvey’s stall phase never had), the cap follows an r64-anchored profile fit instead of a flat multiplier — never tighter than the original cap, so Harvey’s case is unaffected. Rerunning the Gulf-of-Mexico domain with the fix reproduces the wind lull as Ike’s eye passed almost directly over the buoy — confirmed independently by the buoy’s own barometric pressure nearly matching HURDAT2’s official central pressure at that time — and puts the second wind maximum at the right hour (09:00 UTC against 08:50 observed). It does not fix the intensity. Checked against the forcing files themselves, the modeled peak at 42035 is still about 53 m/s against 27.9 m/s observed, and winds on either side of the lull remain roughly twice the observed values; the same overestimate appears at buoy 42001 (about 52 m/s against 30 m/s), and it is the likely reason the deep-water waves there come out too high, below. So the fix repaired the structure of the wind field, not its strength.
Update: the local domain has since been relaunched with a better wind altogether. Separately from the cap fix above, this project’s wind generation was rebuilt around the same GAHM+ERA5 blend used by the SWAN and WW3 workflows (pywaves.common.gahm), which fits both the Holland profile’s radius and shape parameter per quadrant and caps peak wind at 1.05x the storm’s reported intensity rather than 1.25x. At buoy 42035, this cuts the local wind’s peak from about 53 m/s (the cap-fixed wind above) to about 34 m/s against 27.9 m/s observed, and its RMSE from 5.2 to 3.2 m/s. The local Galveston domain was relaunched with this wind, and the wave, current, and storm-surge sections below reflect that relaunched run. One thing did not change at first: the run’s incoming wave-boundary spectra, generated from the Gulf-of-Mexico parent run’s own wave output, still reflected the original, pre-cap-fix wind. The Gulf-of-Mexico domain has since been rerun with the same new wind too (below) — but the local run’s boundary spectra haven’t yet been regenerated from that rerun and the local domain hasn’t been relaunched a second time, so the local wave, current, and storm-surge numbers below still carry wave energy built on the oldest, least accurate wind of the three at their open boundary. That’s a concrete, now-unblocked next step, not yet done.
Deep-water wave validation across the Gulf
The Gulf-of-Mexico parent run — the domain that feeds the local Galveston mesh — can be checked against NDBC buoys from the open ocean to the shelf. Nine of the ten buoys in the model’s station list have 2008 records (42012 doesn’t); 42035 is only 15 m deep and is covered by the local-domain validation below. That leaves eight: three in deep water (3,100–3,600 m), two on the continental slope (180–300 m) and three on the shelf (50–85 m). This section originally compared the original wind against the intermediate, cap-only fix; the Gulf-of-Mexico parent domain has since been rerun with the same pywaves wind used for the local relaunch above, so the figures and table below instead compare that old cap-fixed wind against the new pywaves wind, on the same Gulf mesh and the same ERA5 wave-boundary spectra throughout.
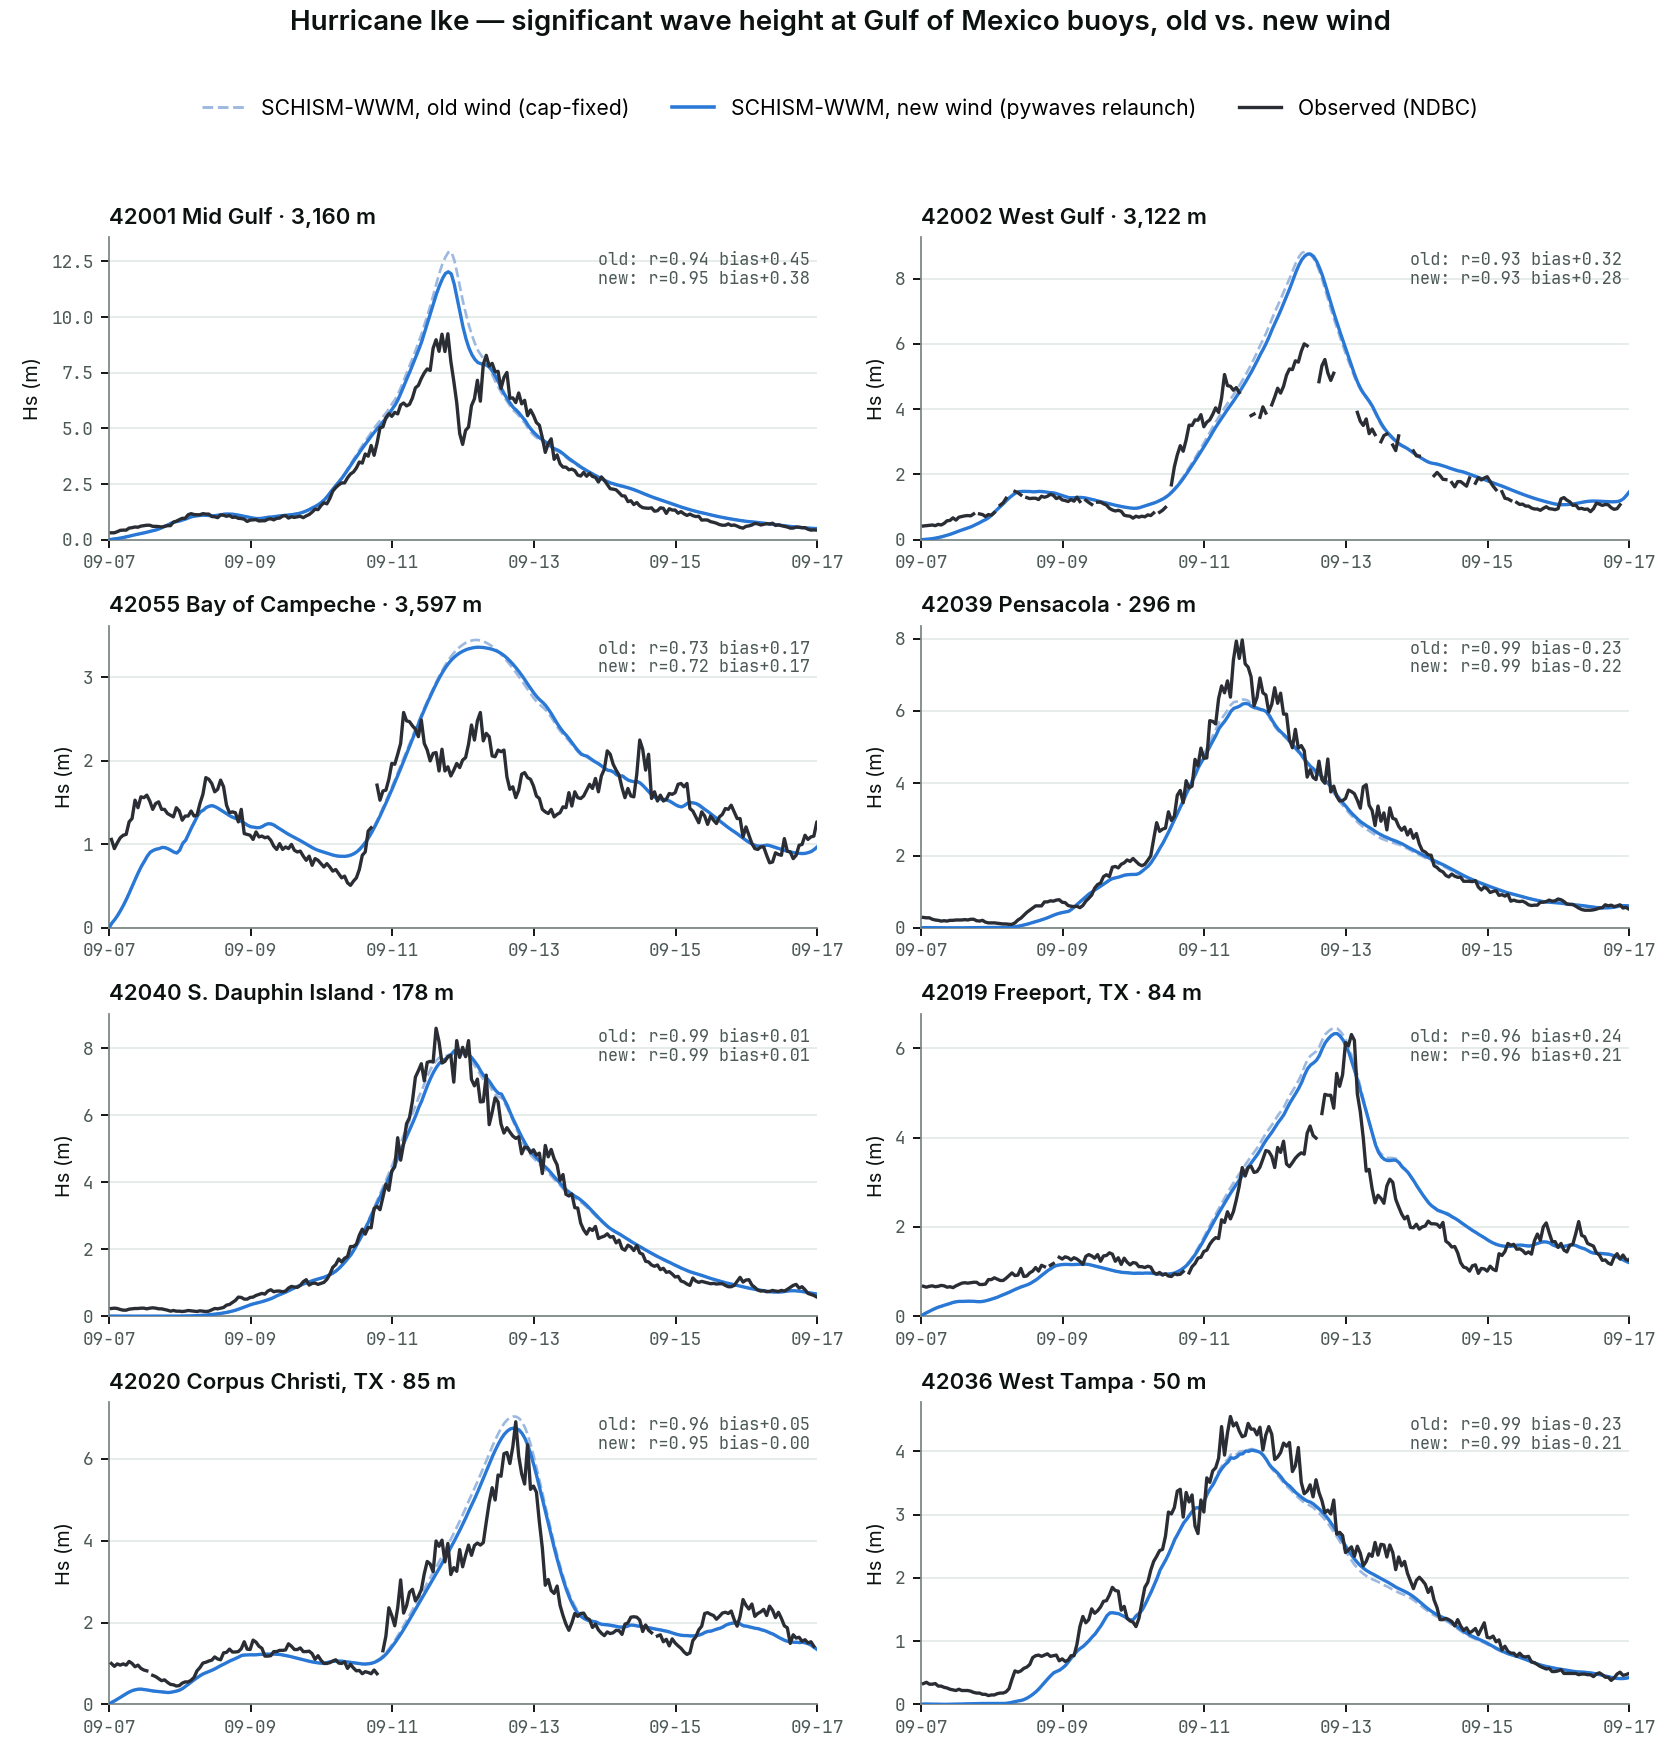 Fig. 2 — Significant wave height at eight Gulf buoys, deepest first: observed (black), old cap-fixed wind (dashed), new pywaves wind (blue). The statistics in each panel are for the new-wind run over Sept 7–17.
| Buoy | Depth | Corr, old → new | Bias, old → new | RMSE, old → new | Peak Hs, obs → old → new |
|---|---|---|---|---|---|
| 42001 Mid Gulf | 3,160 m | 0.94 → 0.95 | +0.45 → +0.38 m | 1.28 → 1.05 m | 9.2 → 12.9 → 12.0 m |
| 42002 West Gulf | 3,122 m | 0.93 → 0.93 | +0.32 → +0.28 m | 0.97 → 0.94 m | 6.0 → 8.8 → 8.8 m |
| 42055 Bay of Campeche | 3,597 m | 0.73 → 0.72 | +0.17 → +0.17 m | 0.61 → 0.61 m | 2.6 → 3.0 → 2.9 m |
| 42039 Pensacola | 296 m | 0.99 → 0.99 | −0.23 → −0.22 m | 0.41 → 0.42 m | 8.0 → 6.3 → 6.2 m |
| 42040 S. Dauphin Island | 178 m | 0.99 → 0.99 | +0.01 → +0.01 m | 0.35 → 0.40 m | 8.6 → 7.9 → 7.9 m |
| 42019 Freeport, TX | 84 m | 0.96 → 0.96 | +0.24 → +0.21 m | 0.64 → 0.60 m | 6.3 → 6.5 → 6.3 m |
| 42020 Corpus Christi, TX | 85 m | 0.96 → 0.95 | +0.05 → −0.00 m | 0.59 → 0.54 m | 6.9 → 7.0 → 6.7 m |
| 42036 West Tampa | 50 m | 0.99 → 0.99 | −0.23 → −0.21 m | 0.31 → 0.30 m | 4.5 → 4.0 → 4.0 m |
The timing and shape of the storm’s wave field are captured well: correlation is 0.93–0.99 at six of the eight buoys, 0.95 at Corpus Christi, and 0.72 at Bay of Campeche, which is far from the storm with waves under 3 m. On the slope and shelf the peaks are close — within about 5% at Freeport and Corpus Christi, 8–9% low at Dauphin Island and West Tampa, and 22% low at Pensacola — though the peaks at Dauphin Island and West Tampa arrive 6–7 hours late in the model.
In deep water the model is still too high, even with the better wind. Peak Hs is 12.0 m against 9.2 m observed at 42001 (about 30% high, down from 40% with the old wind) and 8.8 m against 6.0 m at 42002 (about 47% high, unchanged). The 42001 result is honestly a modest gain: fixing that buoy’s own wind cut its peak by about a third (52 → 35 m/s against 30 m/s observed), but the wave height it drove there fell only from 12.9 to 12.0 m. Deep-water wave growth integrates wind over a broad fetch and over time, not just the single point at the buoy, so a point-wind fix only partly reaches the wave field there — the same kind of gap between fixing an input and fixing the output that shows up again, more sharply, in the local storm-surge result below. At 42002 the local wind barely moved either way (its own RMSE rose slightly, 1.7 → 1.8 m/s), so its persistently high waves are still most likely swell carried in from nearer the storm core, as before, though I haven’t verified that. The 42001 record also shows a sharp drop right after the peak, consistent with the storm center passing close by, which the model smooths over.
Elsewhere, the new wind made little direct difference, and what moved was mostly indirect. RMSE at the three slope/shelf buoys and at 42002 shifted by no more than about 0.05 m between the old and new wind. The one exception is a slight worsening at Dauphin Island (0.35 → 0.40 m) despite that buoy’s own local wind being unchanged between the two runs — consistent with Tp and mean wave direction also shifting slightly at buoys with unchanged local wind, below: swell generated near the storm core, where the wind did change, propagates outward and reaches these buoys too. These Gulf-scale results are also what reaches the local Galveston domain through its open boundary, once that boundary is regenerated from this run (not yet done, see above).
Wind speed and direction
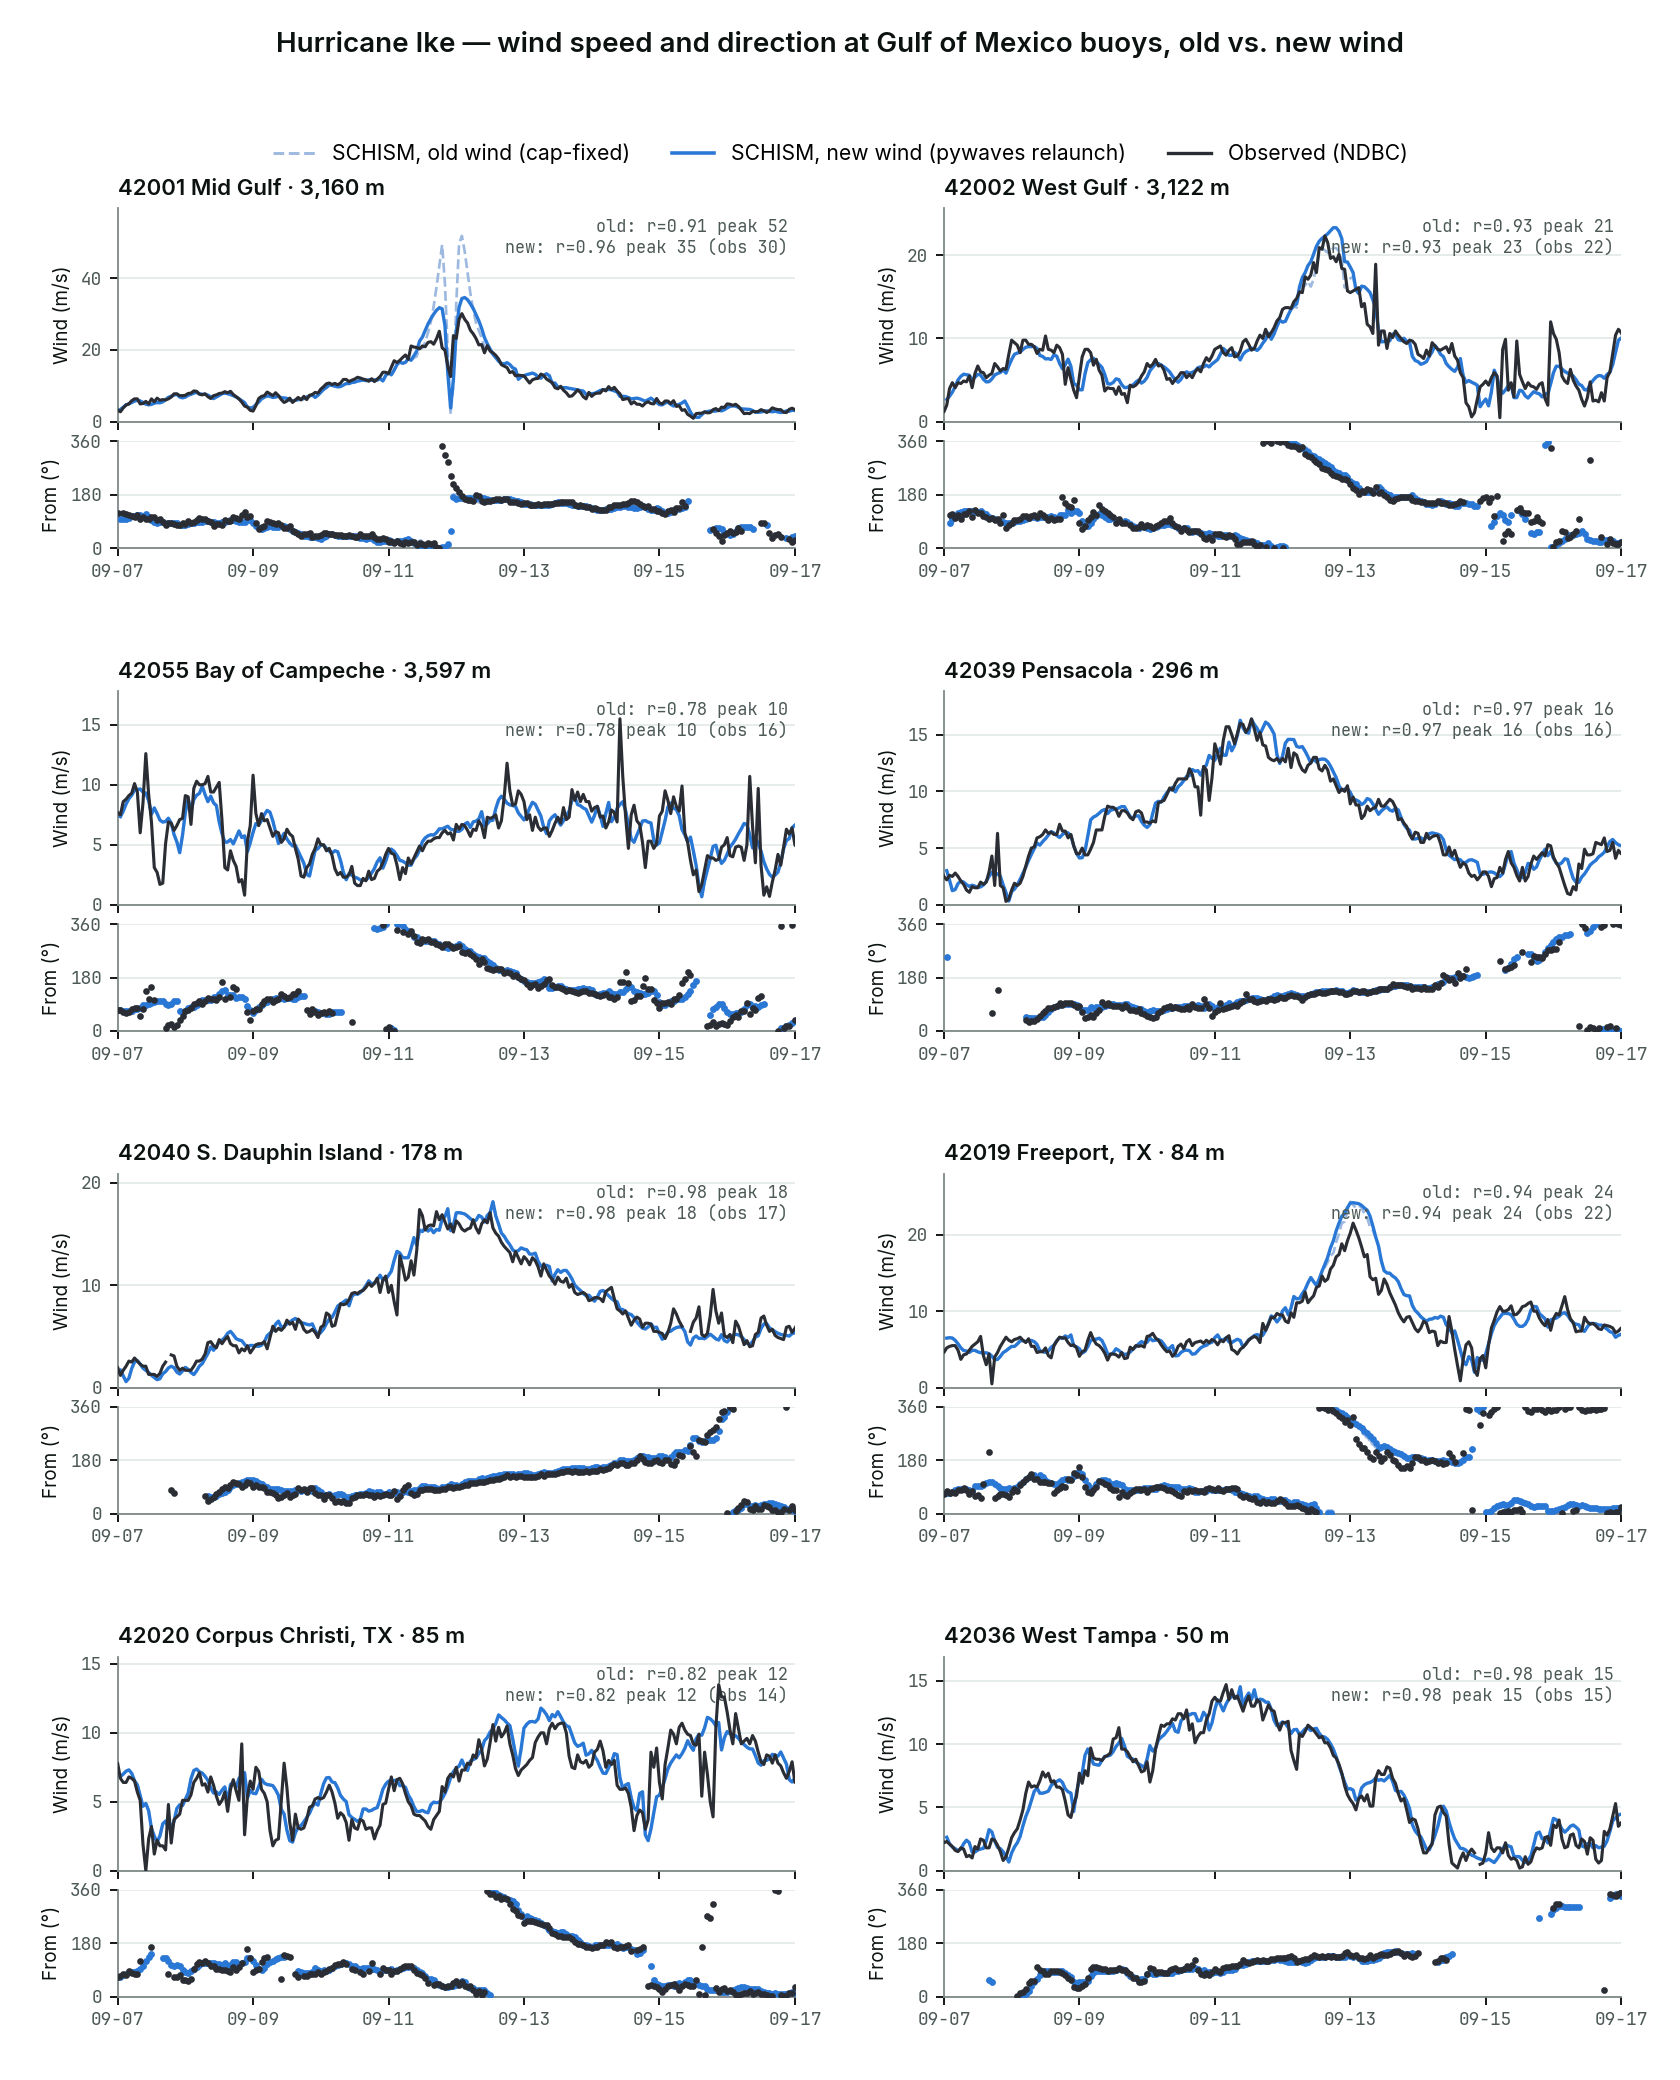 Fig. 3 — Wind speed (upper panel of each pair) and the direction the wind comes from (lower panel; only where the wind exceeds 3 m/s). Model values are the 10-m wind at the nearest mesh node, compared with the buoy anemometers (about 5 m above the sea; adjusting to 10 m would raise the observations by roughly 5–10%, which doesn’t change the picture).
Away from the storm core the two winds are nearly identical, and both are captured closely against the observations: correlation is 0.91–0.98 at six of the eight buoys (0.78 at Bay of Campeche and 0.82 at Corpus Christi, where the wind is light and gusty), biases are within about ±0.7 m/s, and the wind direction is right to within about 7–20° on average (worst at Freeport, where the model runs about 20° too far clockwise). That’s expected: the pywaves refit only materially changes the profile within the fitted radius of maximum winds near the core. At 42001, the buoy closest to the core, it matters a great deal. The old cap-fixed wind produced two sharp spikes of about 52 m/s either side of a brief lull, where the buoy recorded a single broad maximum of about 30 m/s; the new wind cuts that peak to about 35 m/s and its RMSE from 4.1 to 2.2 m/s — real progress, though still about 15% high, and the lull is still too deep.
Peak wave period and mean wave direction
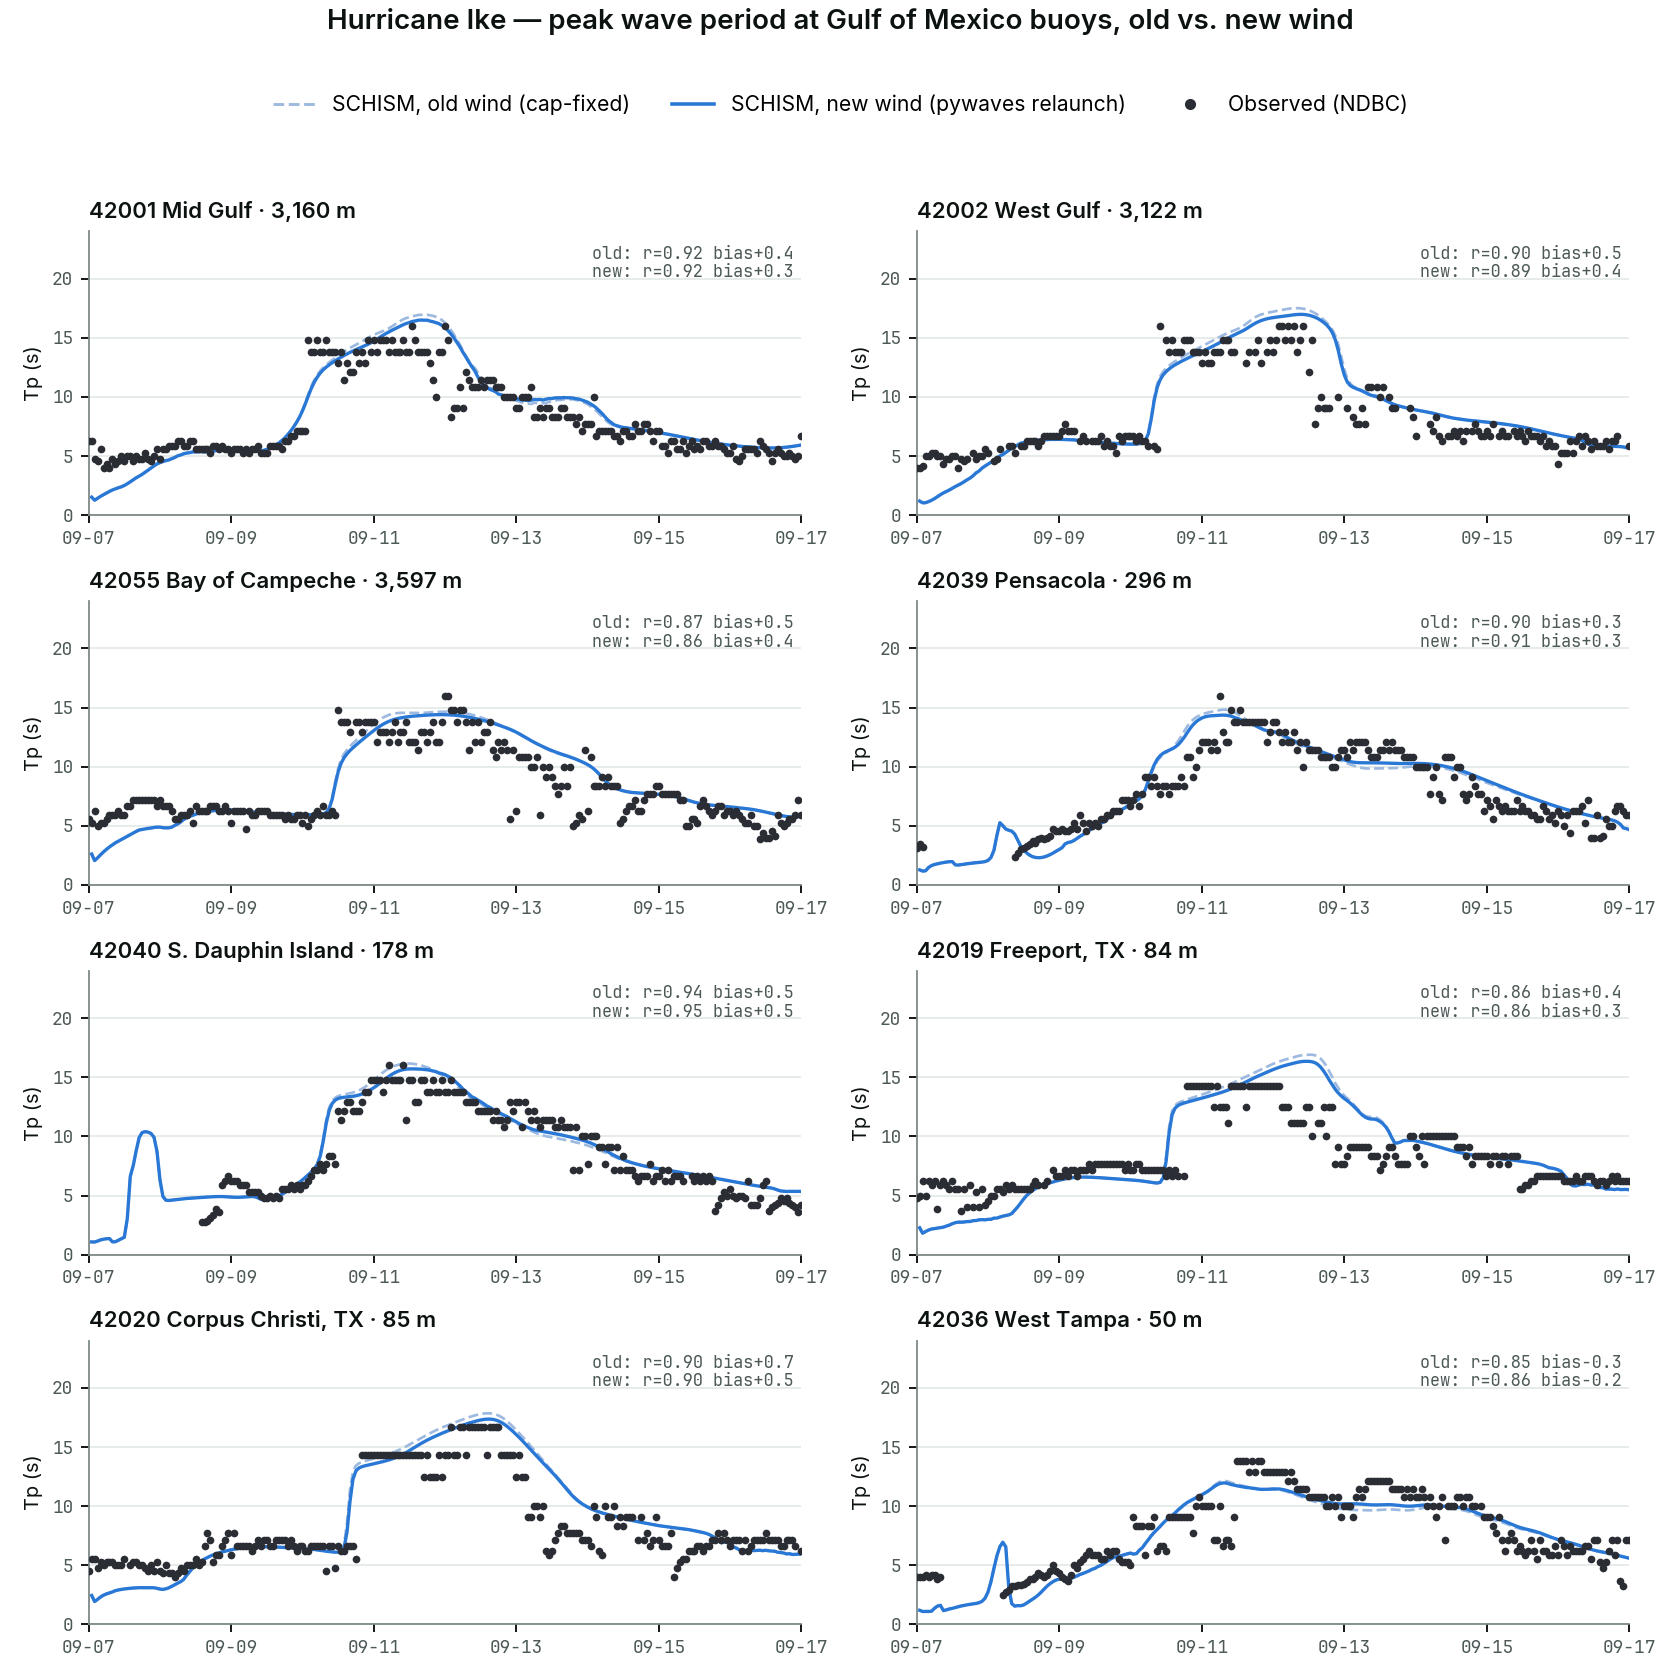 Fig. 4 — Peak wave period. The observed values are NDBC’s dominant period, which is quantized by the buoy’s spectral bins. The model starts from calm on Sept 7, so its first day is spin-up and is included in the statistics.
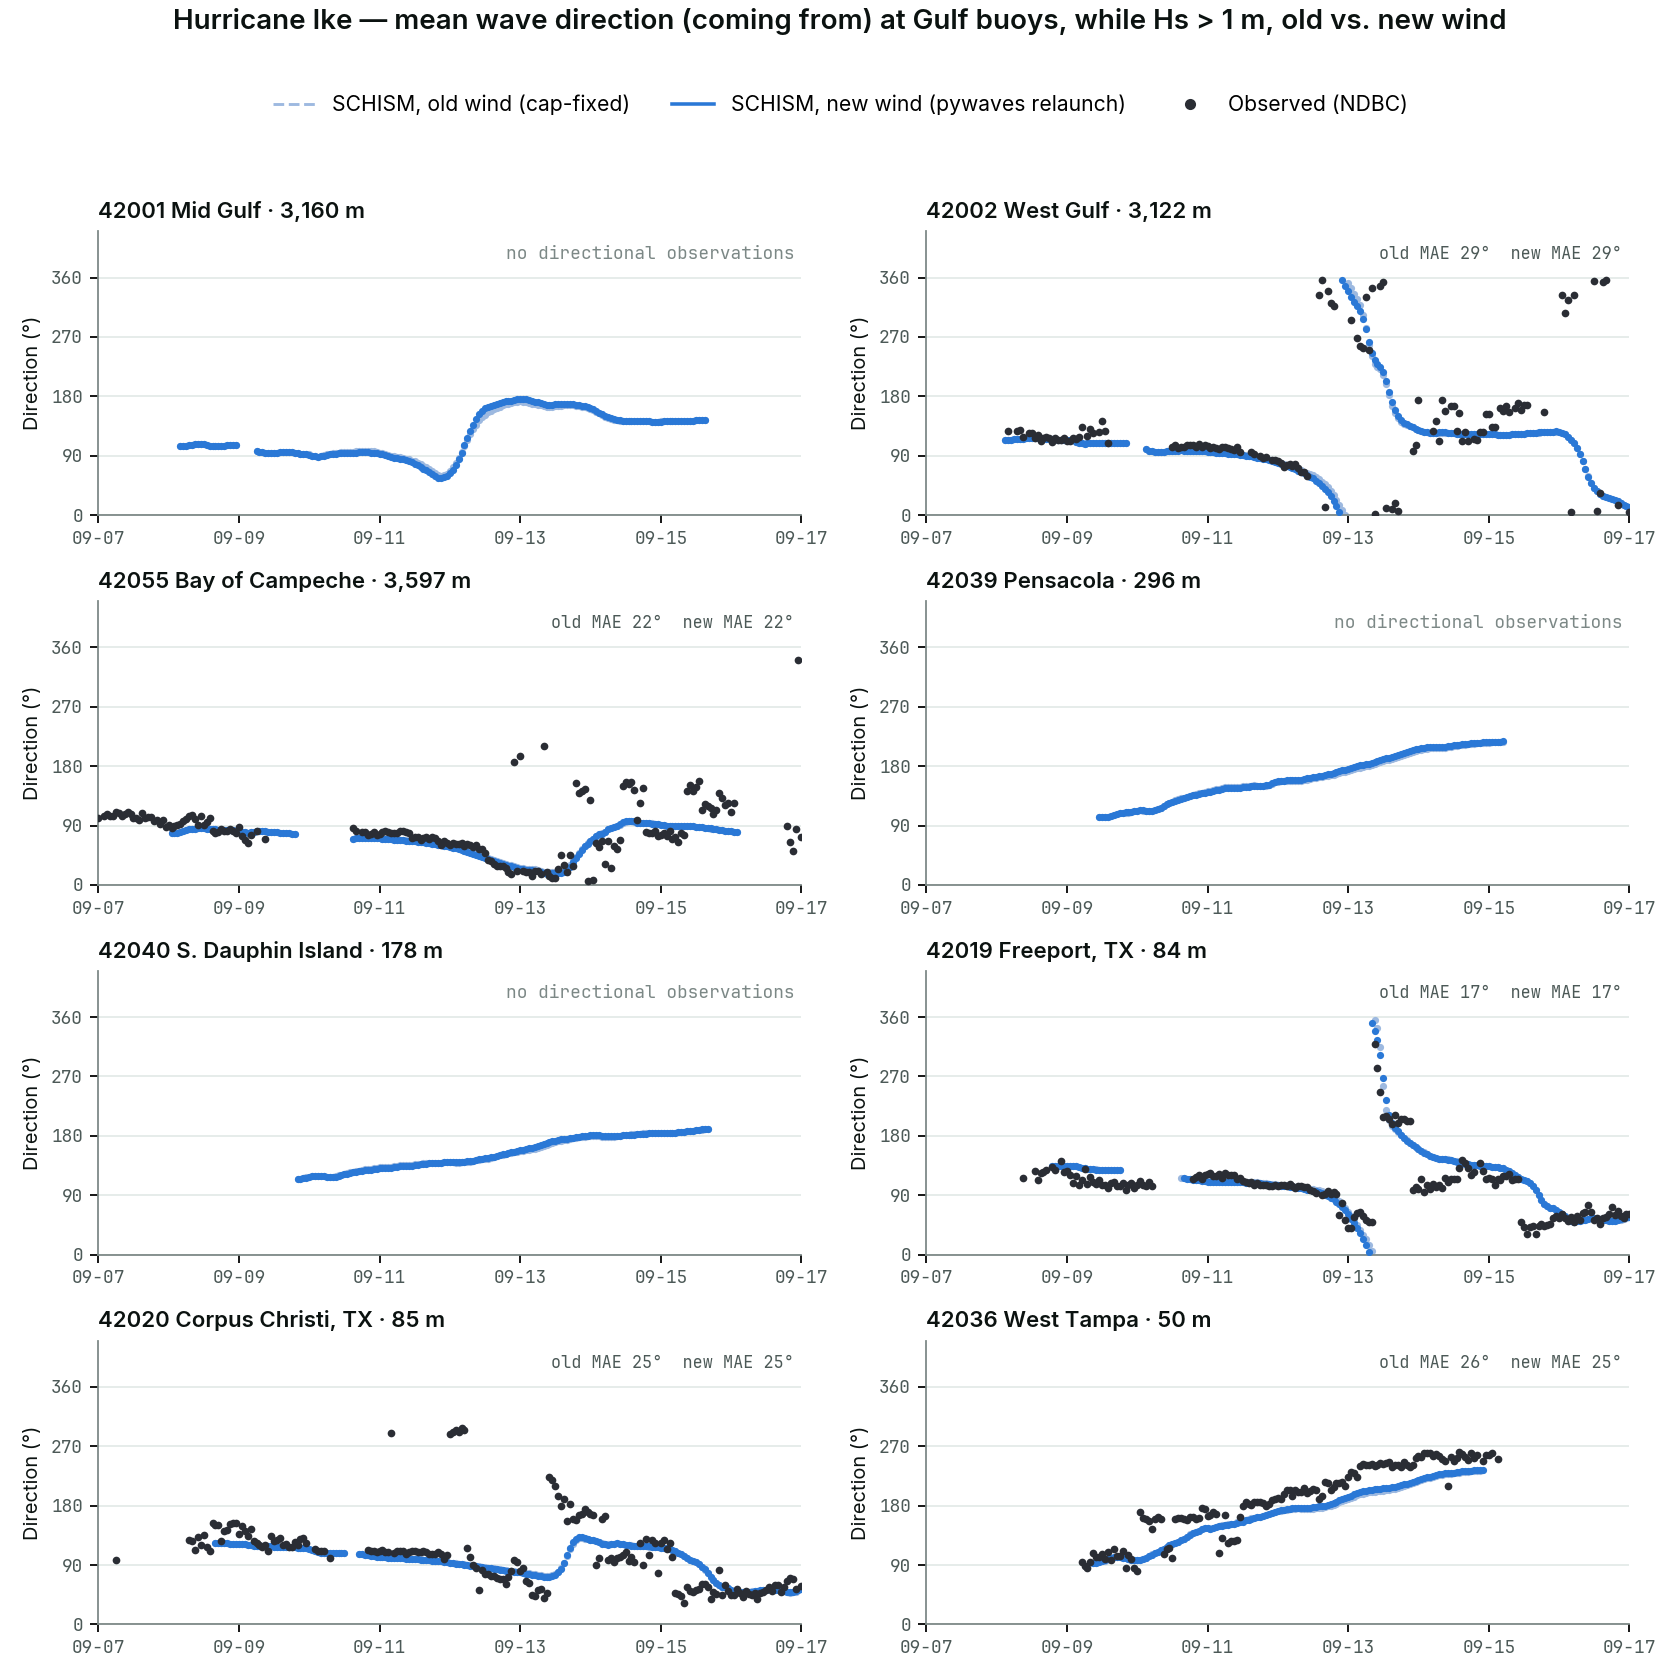 Fig. 5 — Mean wave direction, as the direction the waves come from, shown while the wave height exceeds 1 m. Three of the eight buoys (42001, 42039, 42040) don’t measure wave direction, so only the model is shown there. Statistics are for the new-wind run.
The model reproduces the abrupt arrival of long-period swell (about 14 s) ahead of the storm at most buoys, and the following decay. Correlation is 0.86–0.95, and the model runs about 0.3–0.5 s long at seven buoys (about 5%, which is the resolution of the wave model’s frequency grid) and 0.2 s short at West Tampa. It overshoots the peak period by 1–3 s at the buoys nearest the core (42001, 42002, 42019, 42020) and stays high on the decay at Freeport and Corpus Christi, where the observed period drops as the sea becomes mixed. These numbers barely moved from the old-wind run, and moved by similar small amounts even at buoys whose own local wind is unchanged between the two runs — a further sign that the storm core’s improved wind reaches these buoys indirectly, through swell, rather than only through the local wind.
Wave direction is captured in both shape and sense: the model follows the rotation of the wave direction as the storm passes, with a mean error of 17–29° where it can be checked. I confirmed the model’s direction convention against the observations rather than assuming it (the model matches as a “coming from” direction; flipping it by 180° makes the error about 150–160°). Two caveats: the buoy reports the direction of the dominant waves while the model gives the mean over the whole spectrum, so some systematic offset is expected, and the largest bias, −21° at West Tampa, is a consistent under-rotation late in the storm.
| Buoy | Wind speed: r | bias | peak, obs → model | Wind direction: mean error | Tp: r | bias | Mean wave direction: mean error (bias) |
|---|---|---|---|---|---|---|---|
| 42001 Mid Gulf | 0.96 | +0.4 m/s | 30 → 35 m/s | 8° | 0.92 | +0.3 s | no directional obs |
| 42002 West Gulf | 0.93 | -0.1 m/s | 22 → 23 m/s | 11° | 0.89 | +0.4 s | 29° (-4°) |
| 42055 Bay of Campeche | 0.78 | +0.1 m/s | 16 → 10 m/s | 15° | 0.86 | +0.4 s | 22° (-10°) |
| 42039 Pensacola | 0.97 | +0.2 m/s | 16 → 16 m/s | 7° | 0.91 | +0.3 s | no directional obs |
| 42040 S. Dauphin Island | 0.98 | +0.1 m/s | 17 → 18 m/s | 12° | 0.95 | +0.5 s | no directional obs |
| 42019 Freeport, TX | 0.94 | +0.7 m/s | 22 → 24 m/s | 20° | 0.86 | +0.3 s | 17° (+9°) |
| 42020 Corpus Christi, TX | 0.82 | +0.4 m/s | 14 → 12 m/s | 12° | 0.90 | +0.5 s | 25° (-2°) |
| 42036 West Tampa | 0.98 | +0.1 m/s | 15 → 15 m/s | 8° | 0.86 | -0.2 s | 25° (-21°) |
Statistics are for the relaunched Gulf run (new pywaves wind) over Sept 7–17; wind direction is scored only while the observed wind exceeds 5 m/s, and wave direction only while the observed wave height exceeds 1 m. Away from 42001’s own wind speed, all three of these tables are within a few percent, or a few tenths of a degree or second, of the pre-relaunch run — the wind refit changes little outside the storm core, and even the core change reaches Tp and direction only faintly.
Current
Only one of the eight buoys, 42002 (West Gulf), had a current meter in 2008; NDBC’s current-profiler archive has no 2008 record for the other seven. So this is a single comparison, and the result is a limitation of the model configuration, not a tuning problem. It’s also unaffected by the wind relaunch below: 42002’s own local wind barely changed between the old and new runs, and its modeled current is identical to three decimal places (mean 0.074 → 0.075 m/s, max 0.249 m/s either way).
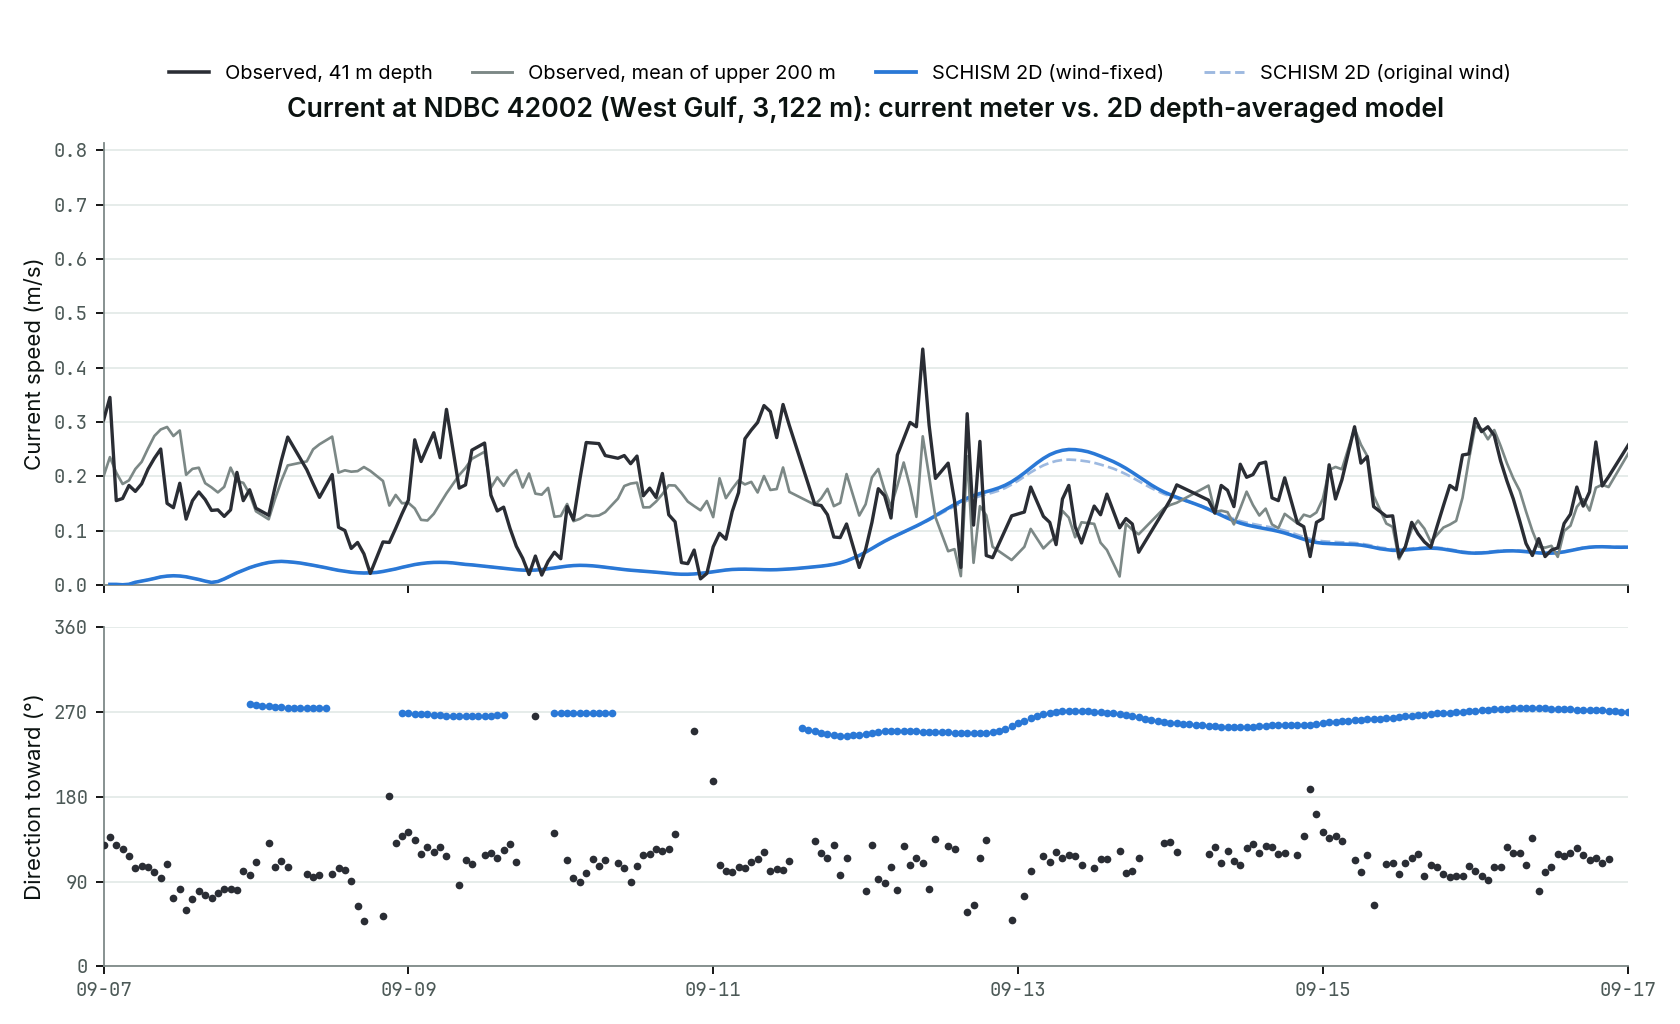 Fig. 6 — Current at 42002 (3,122 m deep). The observations are from the current meter’s 41-m bin and the mean of its bins down to 200 m; direction is the direction the current flows toward, as NDBC defines it. The model is the depth-averaged velocity of the 2D run.
The observed current is a steady 0.15–0.3 m/s flowing toward the east-southeast (about 100–130°) both before and after the storm, with a peak of 0.43 m/s on Sept 12, as the wind at that buoy neared its peak, and little other obvious storm signature. That is the Gulf’s ambient upper-ocean circulation: an independent ocean reanalysis (HYCOM) for the same days shows an eddy field around 42002, with currents of 0.4–0.5 m/s that change direction from one degree of latitude or longitude to the next. The model gives 0.03–0.05 m/s toward the west (about 270°) before the storm, and its current then rises to 0.24 m/s on Sept 13, still flowing west, while the observed current that day is 0.1–0.18 m/s toward the east-southeast — the storm-time pulse is not in the record. Averaged over the period, the model current is 0.07 m/s against 0.17 m/s observed.
A disagreement of nearly 180° can also come from a sign or convention error, so I checked both sides. On the model side, the velocity output is the depth-average, as intended, and its flow follows the model’s own sea-level slope the way Coriolis physics requires: it correlates +0.79 (east) and +0.75 (north) with the geostrophic velocity implied by that slope, where a reversed frame would give negative values. The westward flow is a geostrophic response to the storm’s sea-level pattern, with the high water on its right. On the observation side, NDBC documents the current-meter direction as the direction the current flows toward, which is how it is plotted, and a year-long test of how the measured current turns relative to the wind agrees with that reading; but that test is weak, so I could not verify the 2008 file’s convention independently, and the reanalysis value at the buoy (toward about 30°) matches neither reading, as eddies vary from place to place. The most likely explanation is that the observed flow is ambient circulation the model does not have: the run is 2D and barotropic, with no stratification and no ocean-model boundary condition, so its current in a 3,000-m basin is only the depth-averaged sea-level, wind and tide response, and it overstates the storm-time part of that. Validating deep-water currents would need a 3D baroclinic run with ocean boundary data.
Wave validation: the local domain
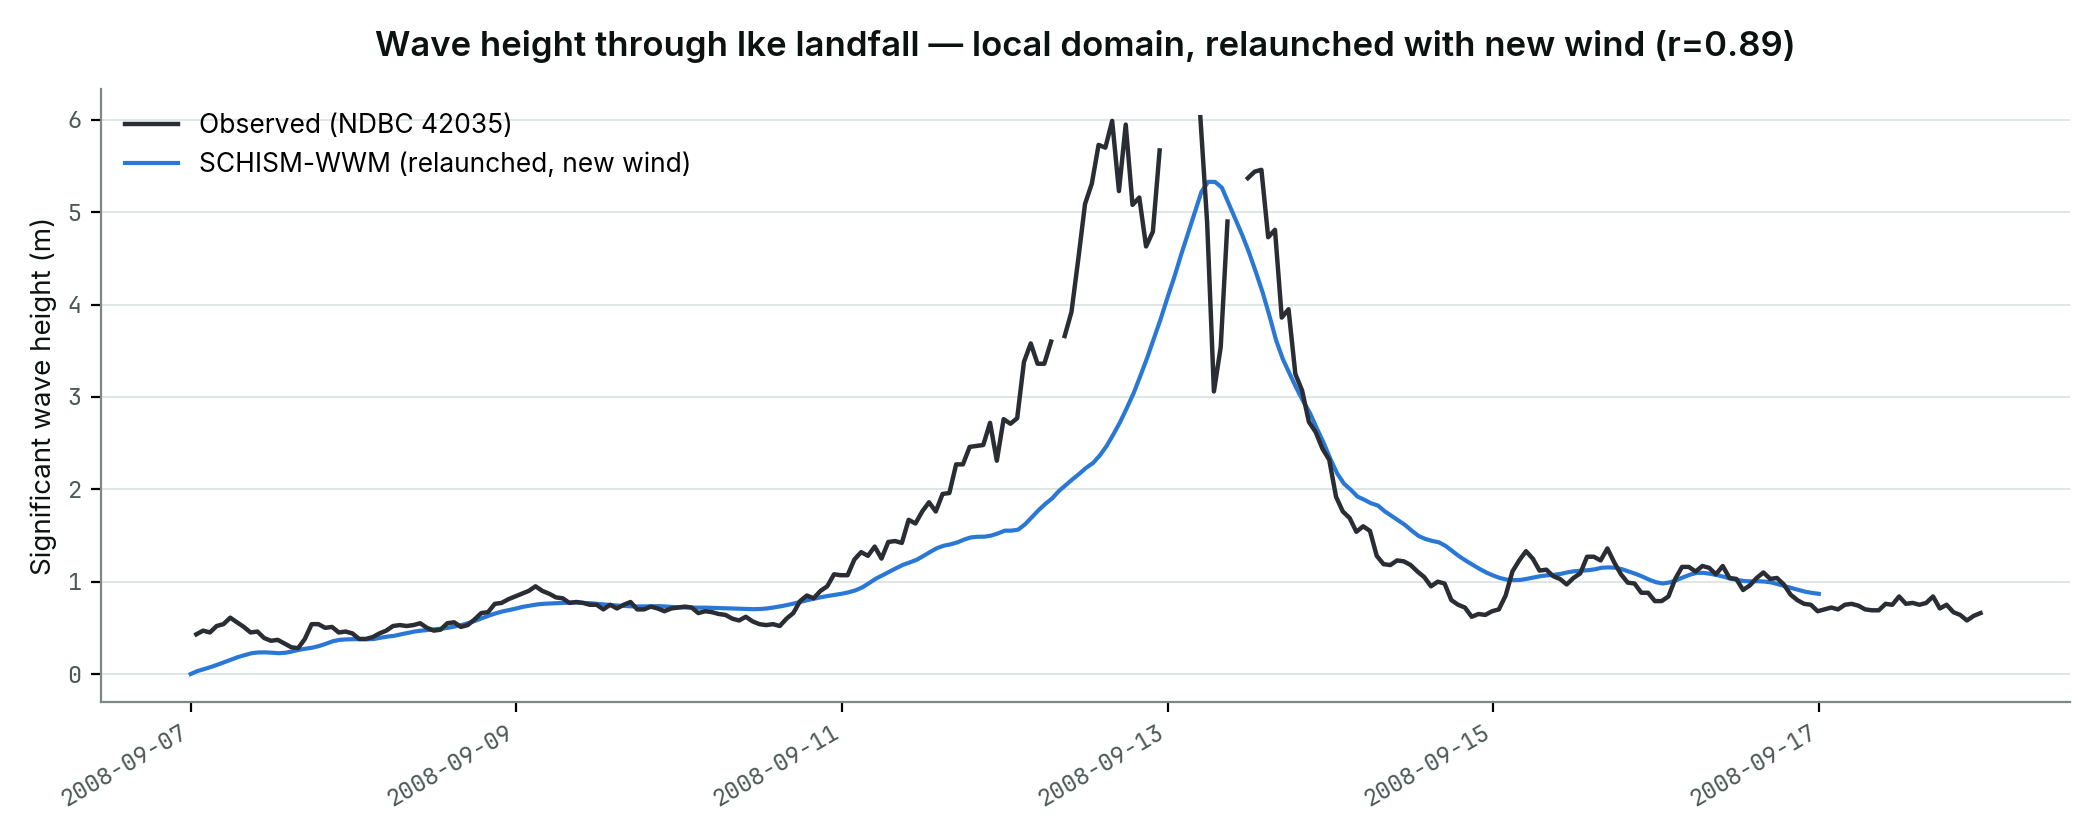 Fig. 7 — Wave height at buoy 42035, relaunched with the new local wind (r=0.89, RMSE 0.80 m, bias −0.28 m). Barely different from the pre-relaunch run (r=0.88, RMSE 0.82 m) — expected, since the boundary spectra feeding this run’s incoming wave energy still reflect the old wind (see above), and local wind mainly affects the near-buoy wind-sea component.
Current at the Bay Entrance
No current-meter record exists near Galveston for Ike. I checked all seven CO-OPS current stations near Galveston, including the Bay Entrance Channel meter used for the Harvey comparison, and none has data for September 2008 (that meter dates from 2011). What does exist is NOAA’s harmonic, tide-only current prediction for the same station. Predictions aren’t observations, but they can be checked: on Harvey’s tide-only days (Aug 21–24, 2017) the prediction matches the real current-meter record closely — mean speed 0.38 m/s predicted against 0.42 m/s observed, correlation 0.93. That makes it a fair benchmark for Ike’s own tide-only days, Sept 7–10, before the storm’s effects reach the coast.
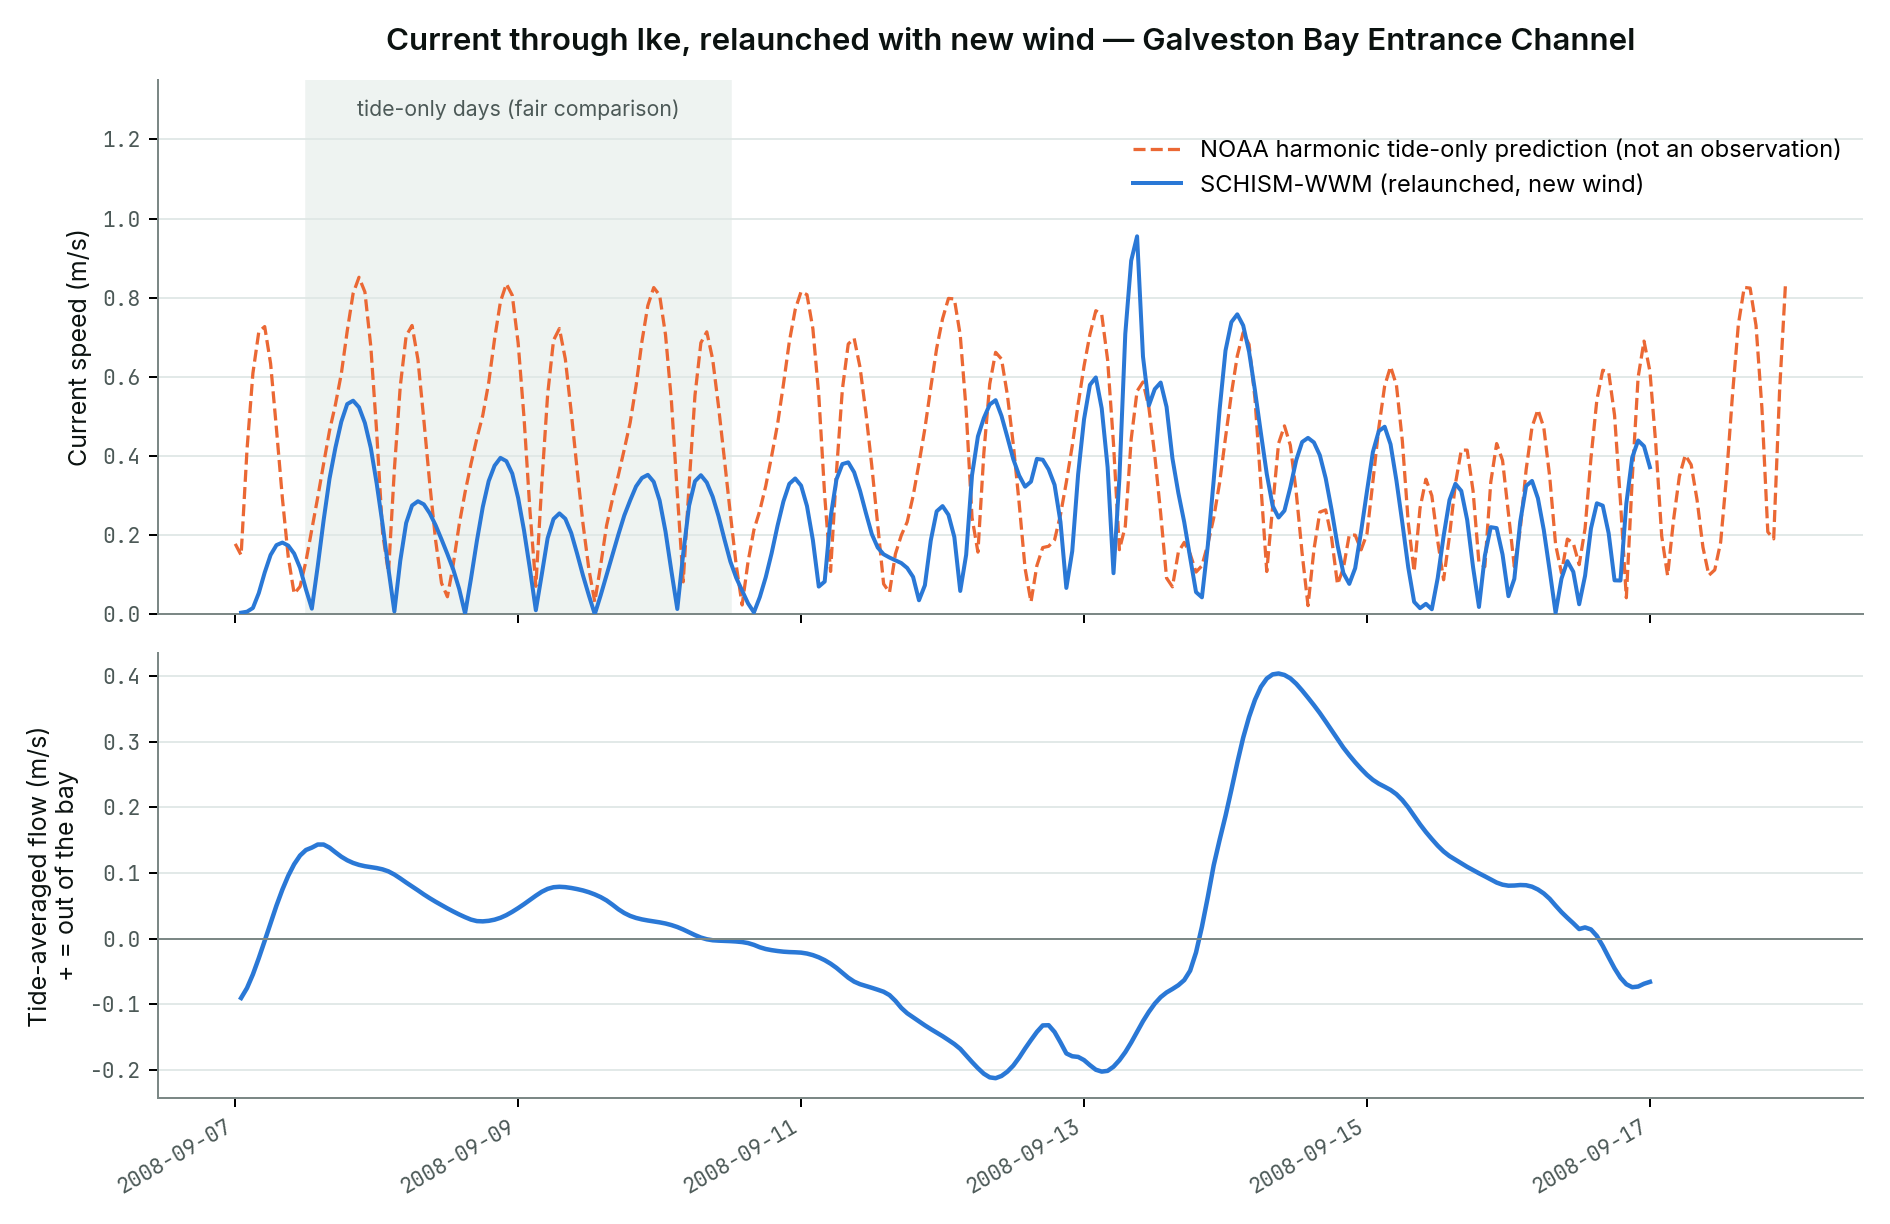 Fig. 8 — Current at the Bay Entrance Channel, relaunched run. Top: SCHISM-WWM (2D, depth-averaged) against NOAA’s tide-only prediction. Bottom: the model’s tide-averaged flow along the channel, positive out of the bay (model only). Over the tide-only days (shaded) the model’s mean speed is 0.23 m/s against 0.47 m/s predicted — half — with a correlation of 0.77, unchanged from the pre-relaunch run: this window is well before landfall, where the new and old wind are nearly identical.
That is the same shortfall found on the Harvey page (0.48 of the observed speed there), and it appears here on a different local mesh. Short reruns of the Harvey setup point to the model’s smoothing settings (a Shapiro filter and horizontal viscosity) as the main cause, and this run uses the same settings. Once the storm arrives there is nothing to score the model against; with the new wind the storm-time numbers are somewhat smaller than before — the bay fills to about 0.21 m/s into the bay (was 0.28), a peak instantaneous speed of 0.96 m/s near landfall (was about 1.0), and a drain of about 0.40 m/s out of the bay on Sept 14 (was 0.45). The run has no river or rainfall inflow — the term that was largely missing for Harvey’s storm-time outflow — and how large it would be for Ike is unknown, so those storm-time magnitudes are model-only numbers, not validated ones.
Storm surge: correcting the reference level
The raw model-vs-observed water-level comparison carried a substantial negative bias at every station — up to 0.87 m at the worst one. Part of that traces to a genuine bathymetric datum mismatch: NOAA’s Coastal Relief Model, despite being labeled MSL/EGM2008, retains its original bathymetric source data referenced to MLLW/MLW instead. Pulling each station’s own MSL−MLLW offset from CO-OPS’s datum API (0.18–0.30 m depending on station) and applying it to the model’s output — shifting it onto the same MSL reference the observations use — recovers a substantial share of that bias.
Fixing the wind made the surge worse, not better — an important, honest finding. With the old, overly strong wind, the model happened to reach 88% of the recorded surge peak at Pier 21. With the corrected, weaker local wind, it reaches only 66%, and the gap widens at every one of the five gauges. The old wind’s excess strength had been an accidental, compensating error, silently making up for a separate surge shortfall the model has independent of the wind. Removing the wind bias exposes that shortfall rather than fixing it.
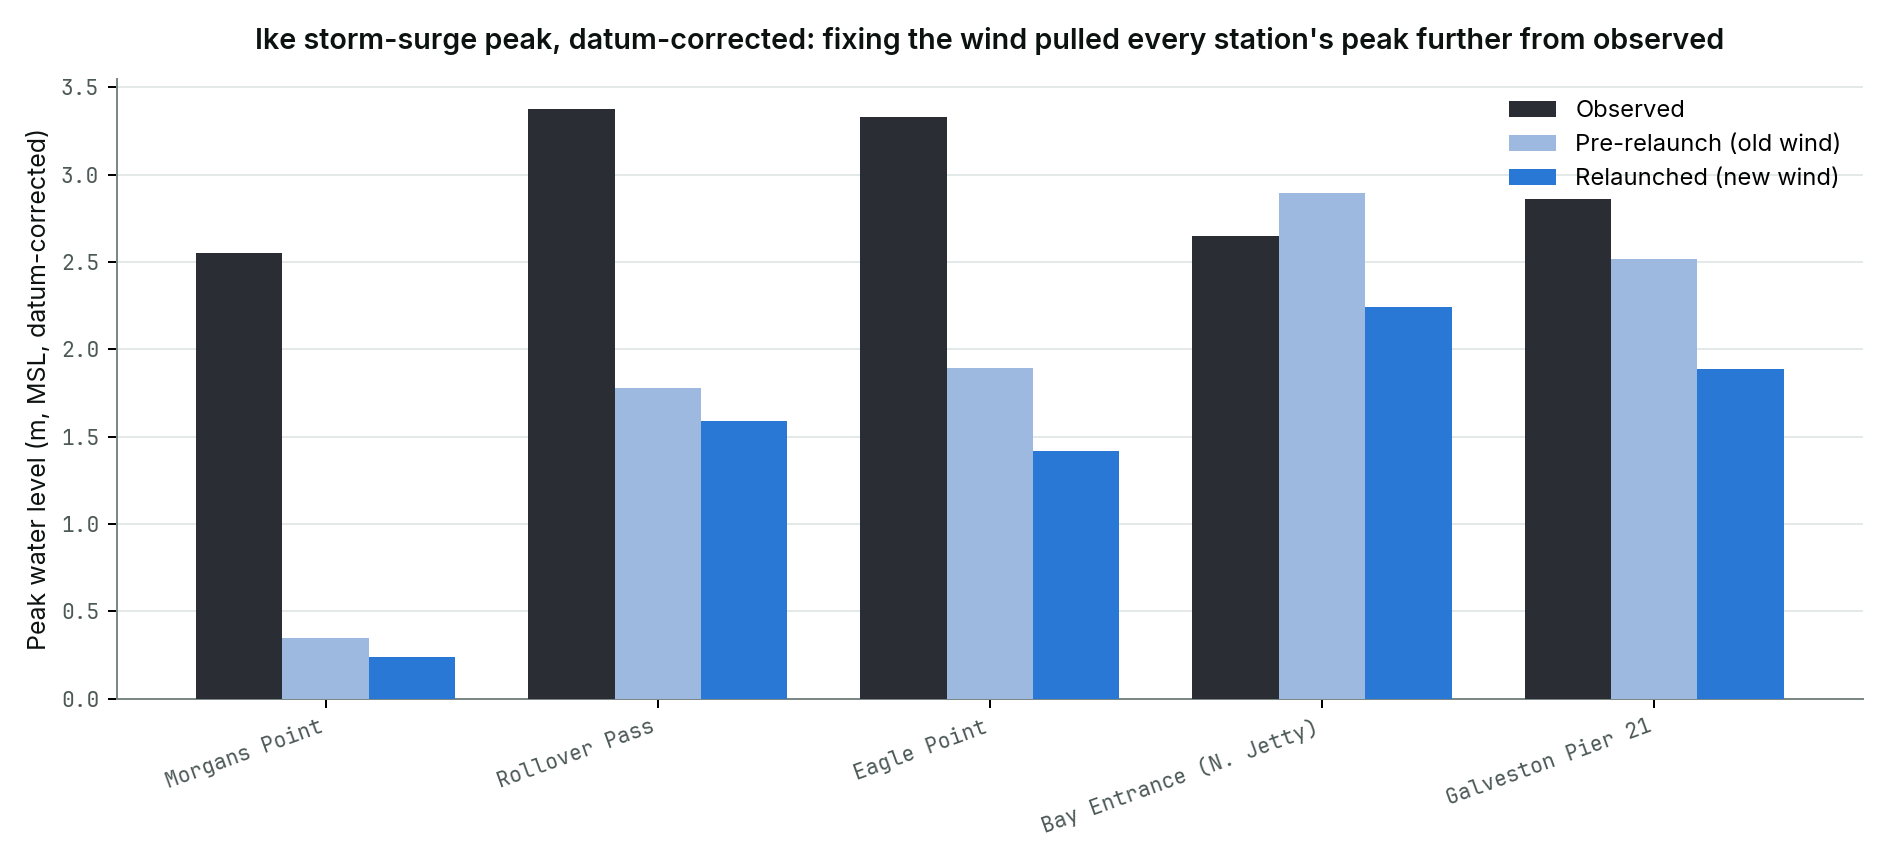 Fig. 9 — Peak storm-surge water level, datum-corrected: observed vs. the pre-relaunch (old wind) and relaunched (new wind) runs. The new wind’s peak is lower than the old wind’s peak at every station, moving further from the observed value in each case.
| Station | Offset applied | Bias, raw → corrected (relaunched) | RMSE, raw → corrected (relaunched) | Corr (relaunched) | Corr (pre-relaunch) |
|---|---|---|---|---|---|
| Morgans Point | +0.22 m | −0.63 → −0.41 m | 0.90 → 0.76 m | 0.23 | 0.80 |
| Rollover Pass | +0.23 m | −1.68 → −1.45 m | 2.12 → 1.95 m | 0.37 | 0.04 |
| Eagle Point | +0.18 m | −0.72 → −0.53 m | 0.83 → 0.68 m | 0.89 | 0.90 |
| Bay Entrance (N. Jetty) | +0.30 m | −1.39 → −1.10 m | 1.75 → 1.53 m | 0.35 | 0.87 |
| Galveston Pier 21 | +0.25 m | −0.62 → −0.37 m | 0.68 → 0.47 m | 0.95 | 0.93 |
Bias and RMSE got worse, not just the peak — the datum correction still helps by the same mechanical amount, but there’s more error left for it to correct. Correlation moved in different directions by station, and not always for a reason I can explain. At Pier 21 and Eagle Point it stayed about the same or improved slightly; at Morgans Point it collapsed from 0.80 to 0.23, but that station’s peak is tiny either way (0.24–0.34 m modeled against 2.55 m observed, see the peak table below), so its correlation was always the timing of a small, noisy signal. At the Bay Entrance, though, correlation fell from 0.87 to 0.35 despite a real, multi-meter signal — I don’t have an explanation for that yet, and I’m reporting it rather than papering over it. Rollover Pass barely responds at all in either run — the same station that barely responds in the Harvey local run (see the companion write-up), which suggests, though it hasn’t been confirmed, that the cause is how the mesh represents these bay-head locations rather than the storm or the wind.
| Station | Observed peak (MSL) | Peak, pre-relaunch → relaunched | Peak captured, pre-relaunch → relaunched | Peak timing, relaunched (model − obs) |
|---|---|---|---|---|
| Galveston Pier 21 | 2.86 m (Sep 13, 03:00; 5-hour gap in the record around it) | 2.52 → 1.89 m | 88% → 66% | +6 h |
| Eagle Point | 3.33 m (Sep 13, 06:00) | 1.89 → 1.42 m | 57% → 43% | +0 h |
| Morgans Point | 2.55 m (Sep 13, 07:00) | 0.34 → 0.24 m | 13% → 9% | +0 h |
| Bay Entrance (N. Jetty) | gauge failed around 02:00 on Sep 13, before the peak | 2.90 → 2.24 m | not scorable | +8 h |
| Rollover Pass | record incomplete (156 of 240 hours); its recorded maximum falls on Sep 16, after the storm | 1.78 → 1.59 m | not scorable | −6 h |
Observed peaks at gauges that failed or have gaps near the peak are lower bounds, so the captured fractions above are, if anything, generous to the model. At the open-coast gauge with a nearly complete record, Pier 21, the relaunched model reaches two-thirds of the surge, down from most of it; on the bay’s own shore at Eagle Point it reaches less than half, against about 83% at the same gauge for Harvey. The two bay-head gauges fail in both storms and both wind versions.
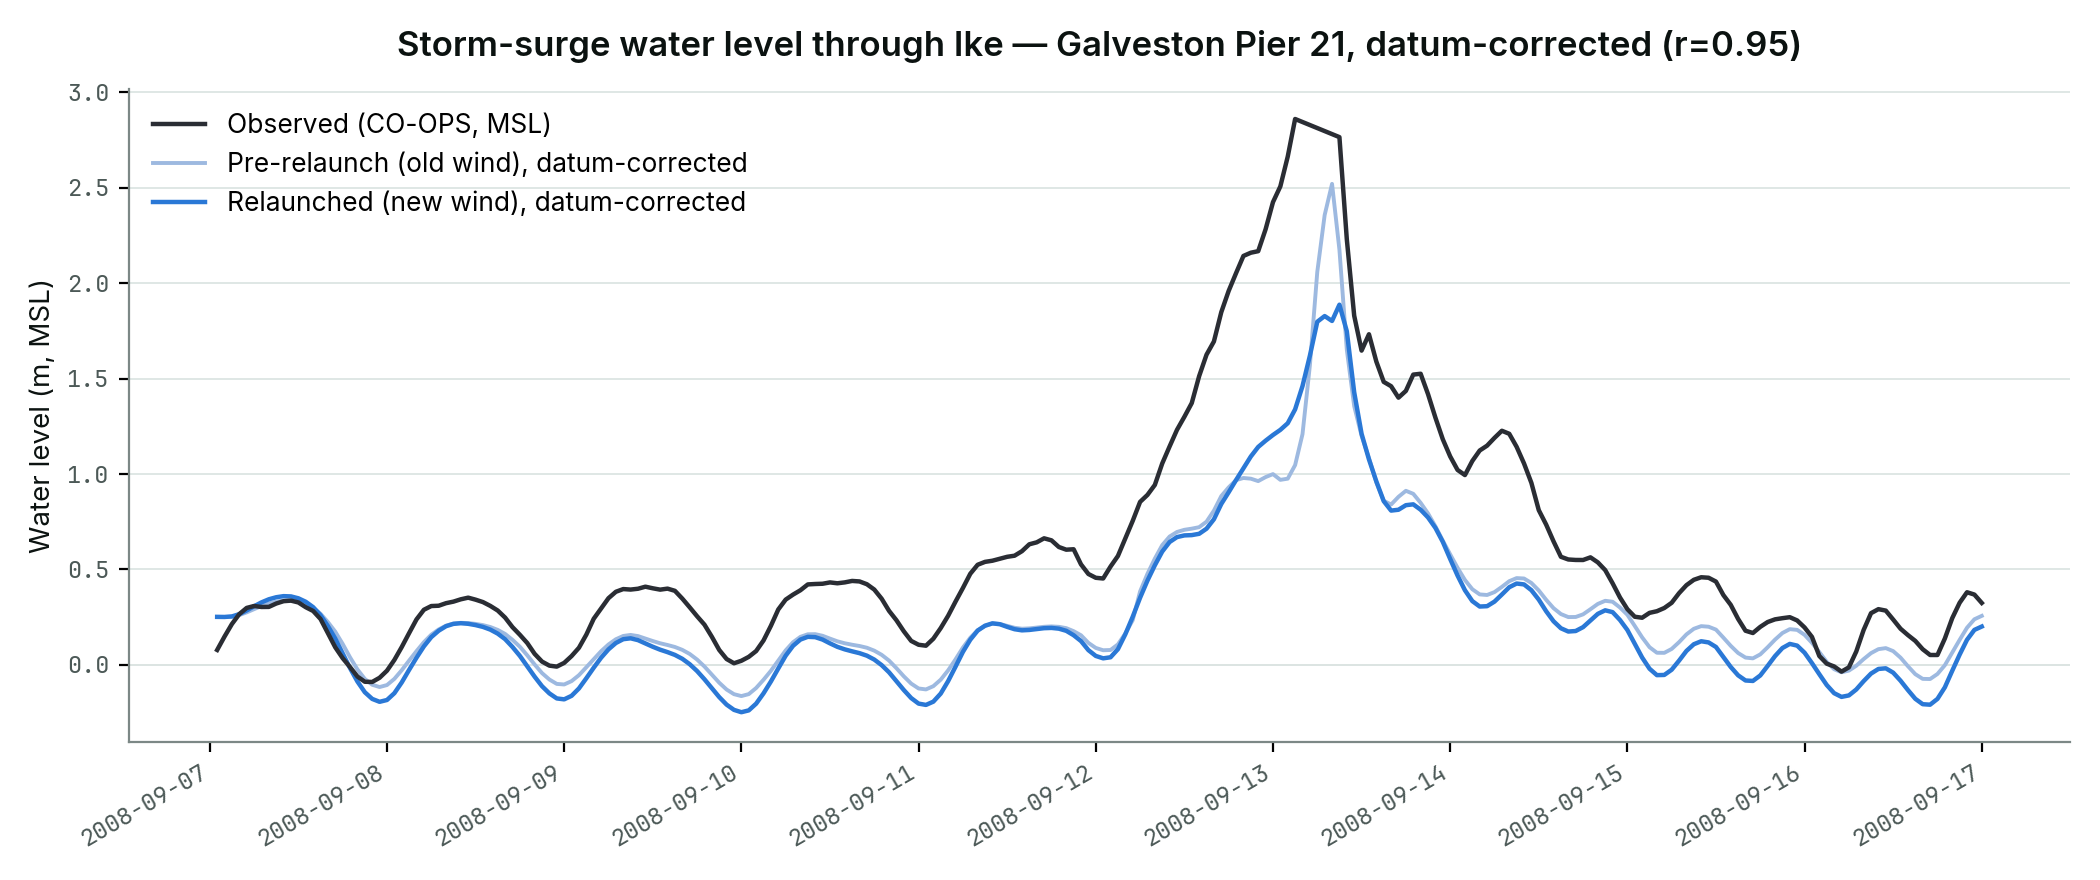 Fig. 10 — Storm-surge water level at Galveston Pier 21, datum-corrected (r=0.95, relaunched run). The relaunched model’s peak (1.89 m) sits well below both the observed peak (2.86 m) and the pre-relaunch run’s peak (2.52 m) — visible confirmation that removing the wind’s overestimate removed a real, if inadvertent, source of accuracy.
That leaves an open question this write-up doesn’t answer: something other than wind strength is holding this run’s surge peak down at every gauge, by roughly a third to a half once the datum and the wind are both corrected. Candidates include the same smoothing settings (Shapiro filter, horizontal viscosity) flagged for the weak tidal current below, the stale wave-boundary spectra noted above, or a genuine gap in the surge physics; distinguishing between them needs more runs than this one.
Fixing the offshore boundary
An earlier version of the local mesh (v6) placed its open boundary too close to the continental shelf, costing real wave energy right at the boundary itself: 9.1 percentage points of retention lost in the first hop alone. Moving the boundary further offshore (v7, the mesh used throughout this write-up) cut that loss to 1.3 points.
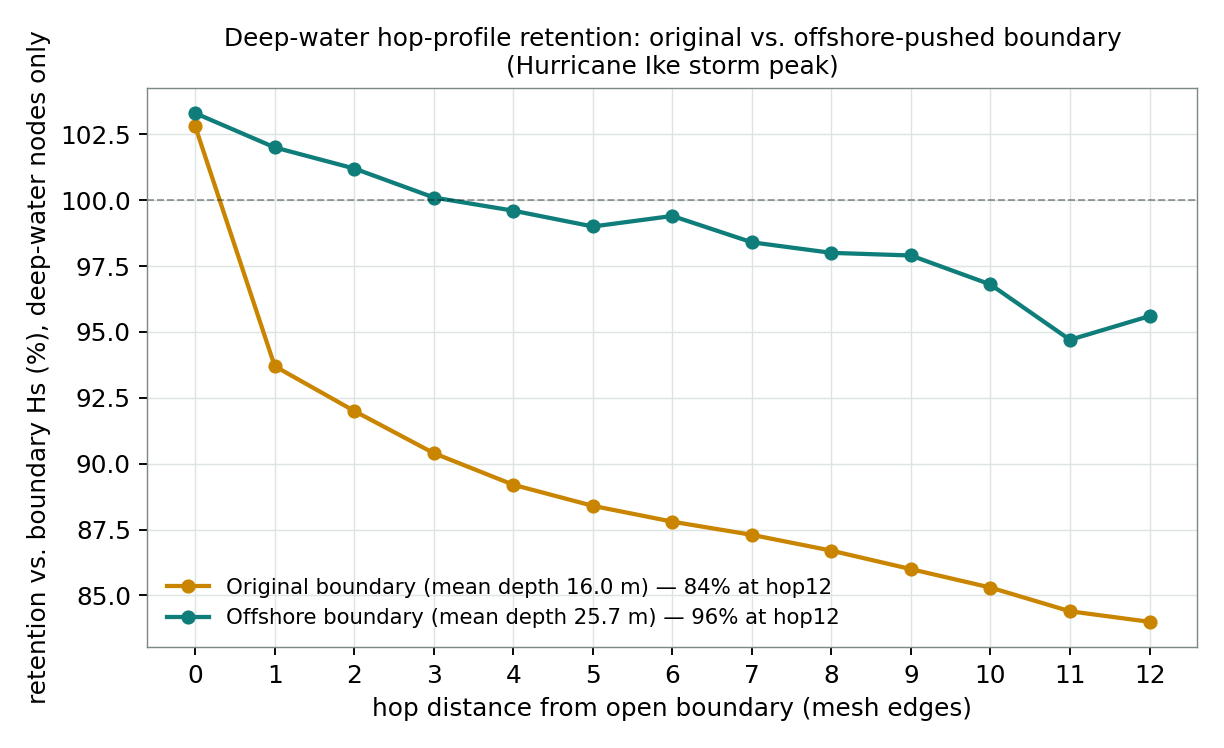 Fig. 11 — Deep-water retention, hop-by-hop, old vs. new boundary. The gap that opens at hop0→hop1 for the old boundary persists through hop12 (84.0% vs. 95.6%); moving the boundary offshore all but closes it.
Diagnosing this also surfaced a separate, genuine finding, not a bug: raw retention figures near the coast looked alarmingly low until split by depth. The shallow subset is breaking-limited — real physics — while the deep-water subset alone tells the true story of how well the boundary itself preserves energy.
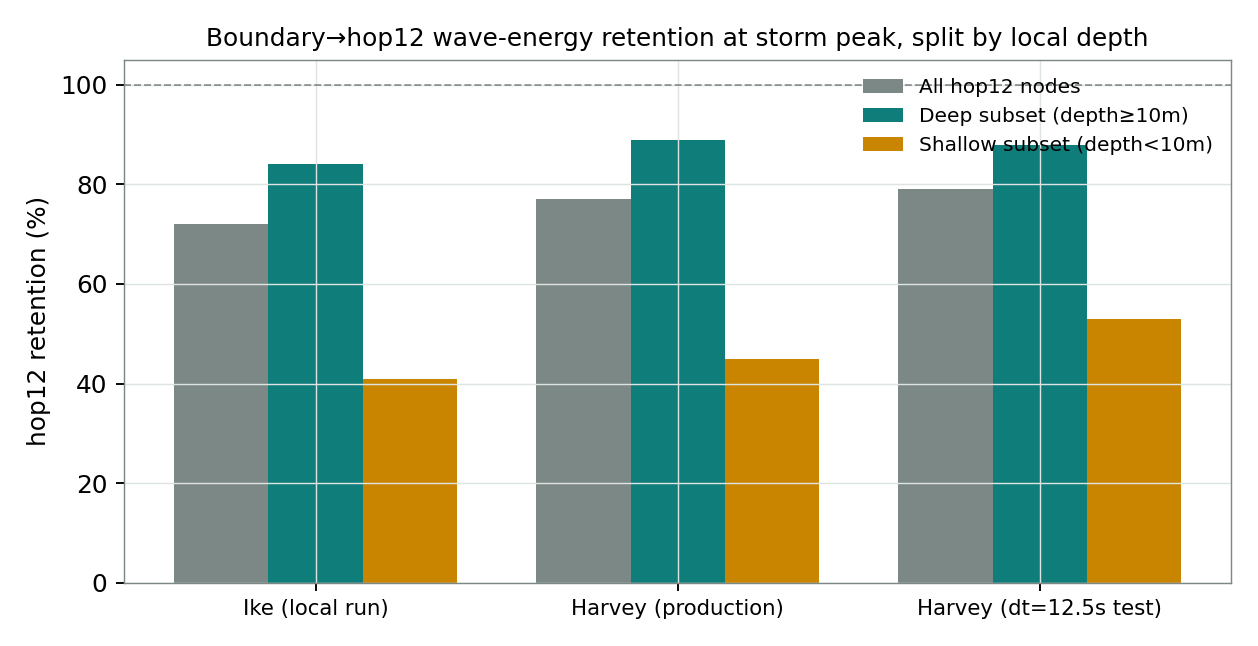 Fig. 12 — Retention split by depth, both storms, same node ring. Deep water clusters tightly at 84–89% for both storms; the low “all hop12” figure that first raised concern was diluted by shallow, physically breaking-limited nodes.
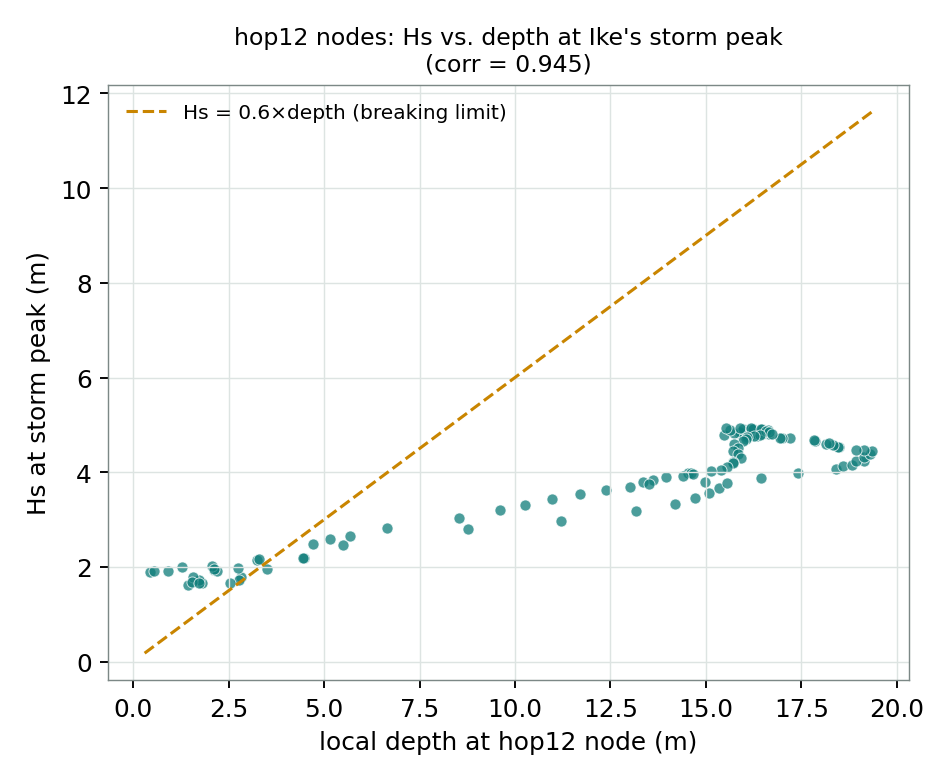 Fig. 13 — Wave height vs. depth at the shallow nodes: the 0.6x-depth breaking limit (Miche/Battjes–Janssen) predicts the ceiling almost exactly (corr(depth, Hs) = 0.945).
Where this leaves the project
The Gulf-scale wind-forcing fix repaired the structure of the wind field (the eye lull and the timing of the second maximum) but not its strength near the core. The pywaves GAHM+ERA5 blend, shared with this project’s SWAN and WW3 workflows, fixed the strength too: relaunched first on the local domain (cutting peak-wind error at buoy 42035 by about 40%) and then on the Gulf-of-Mexico parent domain (the same cut at buoy 42001), it’s now been carried through both. In deep water the payoff was only partial — Hs at 42001 improved from 40% too high to 30%, not to zero, and 42002’s waves didn’t improve at all, since their own local wind was already fine. On the local domain, the relaunch produced this write-up’s most important finding: fixing the wind made the local storm surge worse at every gauge, because the old wind’s overestimate had been silently compensating for a separate surge deficit. What the relaunched run reaches is still substantial — two-thirds of the observed peak at Pier 21 — but the search for that separate deficit (candidates: the smoothing settings noted below, the still-stale local wave-boundary spectra, or a genuine gap in the surge physics) is now the real open problem. The most direct next step is now unblocked: regenerating the local run’s wave-boundary spectra from this relaunched Gulf-of-Mexico run’s own output (they currently still come from the original, pre-cap-fix Gulf run) and relaunching the local domain a second time — not yet done. Getting ADCIRC-SWAN’s Ike setup past its current instability, so a full two-model comparison like the one already done for Harvey becomes possible for this storm too, also remains open. Two problems shared with the Harvey local run also remain open: tidal currents at the Bay Entrance are about half of the predicted speed, and the bay-head gauges at Morgans Point and Rollover Pass barely respond. In deep water, the 2D barotropic run cannot reproduce the observed ambient current at all (checked at 42002, unaffected by either wind version), so any deep-water current validation would need a 3D baroclinic run with ocean boundary data.
Model: SCHISM+WWM. Forcing: GAHM-parametric wind field from HURDAT2 best-track data. Validation: NOAA CO-OPS water-level stations and NDBC buoys.