Hurricane Ike Beach and Dune Erosion Modeling on Bolivar Peninsula (XBeach)
A physics-based storm-impact model of the Bolivar Peninsula barrier breach that Hurricane Ike reshaped in 2008, built from a real regional storm hindcast and checked against airborne pre- and post-storm lidar.
The Challenge
Rollover Pass, an artificial tidal inlet on Bolivar Peninsula, was reshaped by Hurricane Ike’s 2008 landfall. Reconstructing that kind of storm-driven barrier response means simulating the actual physics – waves, currents, and sediment transport together – not just comparing before/after maps, and the result has to be checked against what actually happened, not just judged as “reasonable-looking.”
The Approach
Built a nested regional-to-local model: a coupled SCHISM+WWM storm-surge and wave hindcast of Ike across Galveston Bay and the western Gulf of Mexico, feeding a high-resolution XBeach storm-impact model of the Gilchrist-Rollover Pass reach. A fast, coarsened version was run first to validate the full pipeline – data, boundary forcing, numerics – before committing to the expensive full-resolution run. The result was then checked against NOAA airborne lidar flown before and after the storm.
The Result
The model reproduced the beachface erosion response well (correlation ~0.7 against the lidar record for erosion specifically) and, just as usefully, surfaced a genuine physical limitation of this class of model: it can’t reproduce the slower, wind-driven dune rebuilding that lidar shows occurred between storms – a clear, evidence-based line between what the model can and can’t do.
When Hurricane Ike made landfall near Galveston in September 2008, the surge and waves it drove across Bolivar Peninsula didn’t just flood the coast — they moved the coast, cutting new channels and reshaping dunes in a matter of hours. Reconstructing that kind of change, or predicting it ahead of a future storm, means simulating the physics: how waves break, how currents move water and sand together, and how the seabed responds as both change.
XBeach is an open-source model built for exactly this — storm-scale wave, current, and sediment-transport simulation on sandy coasts. This project applies it to a roughly 10 km reach spanning Gilchrist and Rollover Pass, the section of Bolivar Peninsula where Ike’s impact, and the historical erosion problems at the artificial pass itself, are best documented.
Two versions of the model were built: a full-resolution grid for eventual calibration against the storm record, and a coarser, faster version meant purely to validate the pipeline — the data, the boundary forcing, the numerics — before committing several days of computation to the real thing. Everything below concerns that faster test version.
| Full-resolution model | Fast test version (this write-up) | |
|---|---|---|
| Shoreline detail | as fine as 3 m | as fine as 6 m |
| Grid size | ~415,000 cells | ~104,000 cells |
| Storm window simulated | 48 hours | 36 hours |
| Compute time (8 cores) | ~4 days | ~half a day |
The storm forcing — water level and wave conditions at the model’s offshore edge — comes from a real regional storm-surge and wave hindcast of Ike, not an idealized or synthetic storm.
Where the storm data comes from
Coastal models are typically nested: a large-scale model handles how an entire bay or gulf responds to a hurricane, and a small, high-resolution model like XBeach picks up right at the one boundary where the two meet, adding the beach-scale detail the regional model was never meant to resolve. Here, that regional layer is a coupled SCHISM + WWM simulation of Hurricane Ike across Galveston Bay and the adjacent Gulf of Mexico — SCHISM solving the circulation (water levels and currents driven by wind, pressure, and tide) and WWM solving the wave field on the same unstructured mesh, two-way coupled so that breaking waves feed back into the surge and the evolving surge reshapes the waves.
That mesh is deliberately uneven: tens of kilometers between nodes out in the open Gulf, coarsening because nothing there needs finer detail, down to roughly 500–900 m approaching Bolivar Peninsula, where the storm’s behavior actually matters for this project. From ten days of hindcast bracketing Ike’s approach and landfall, hourly water level and wave conditions (height, period, and direction) were pulled from the nodes nearest the XBeach model’s seaward edge and fed in as its boundary forcing.
Reconciling that regional dataset with the local shoreline survey took real engineering: the two used different map projections, different file formats, and, subtly, different vertical reference levels for “sea level” — a mismatch of about 12 cm that would otherwise have quietly biased every water-level input. All of it was resolved and cross-checked against an independent tide gauge before the model was trusted to run.
- Circulation model: SCHISM (unstructured-grid)
- Wave model: WWM, two-way coupled
- Domain: Galveston Bay & western Gulf of Mexico
- Near-shore mesh spacing: ~500–900 m at Bolivar Peninsula
- Hindcast window: 10 days bracketing landfall
- Boundary data extracted: hourly water level, wave height, period, direction
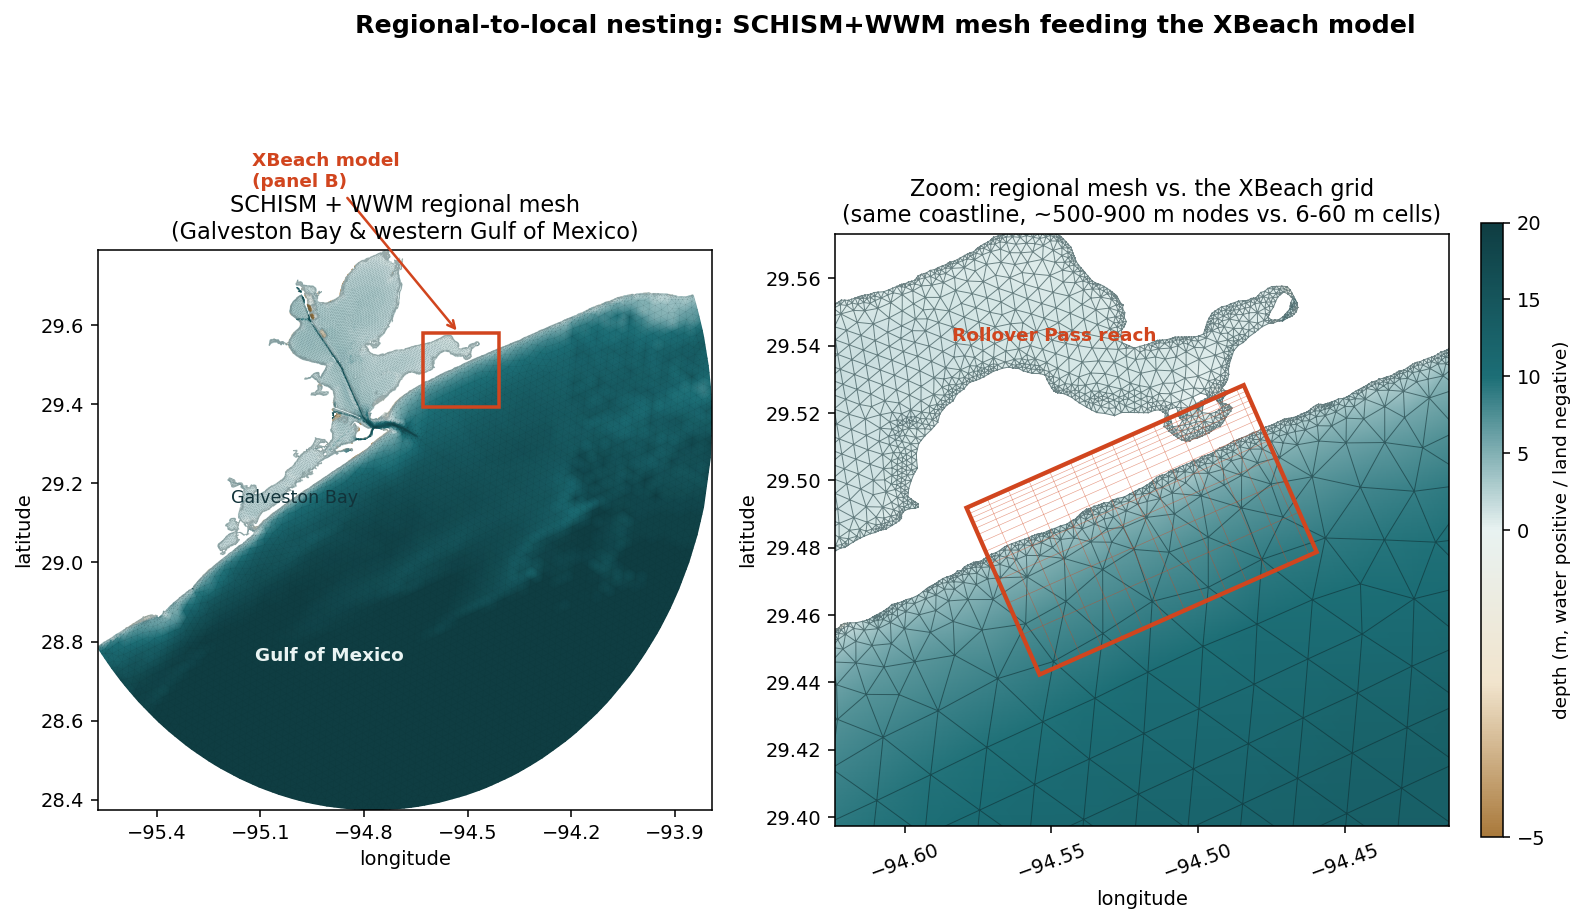 Fig. 1 — The regional mesh that produced the storm forcing (left), and where the XBeach grid sits inside it (right). The unstructured SCHISM+WWM mesh spans the whole bay and adjoining Gulf at variable resolution; XBeach picks up right at its edge, at roughly ten to a hundred times the resolution, to resolve the beach and dune itself.
Testing against reality
A model is only useful if it agrees with what actually happened. Airborne laser surveys flown before and after Ike provide that ground truth.
Comparing a survey flown in 2006 against one flown in 2009 — after correcting a known ~1 m systematic offset between the two survey vintages — isolates how much the ground surface actually changed across the storm. The model’s predicted change was compared against that record wherever the two overlap: the dry beach and dune footprint the surveys can actually see (the surveys can’t measure underwater, so open water is excluded).
| Agreement metric | Whole overlap area | Areas of clear change | Erosion only |
|---|---|---|---|
| Correlation | 0.63 | 0.72 | 0.73 |
| Average difference | −0.28 m | — | — |
| Typical error | 0.40 m | — | — |
| Agrees on erosion vs. growth | 66% | 66% | — |
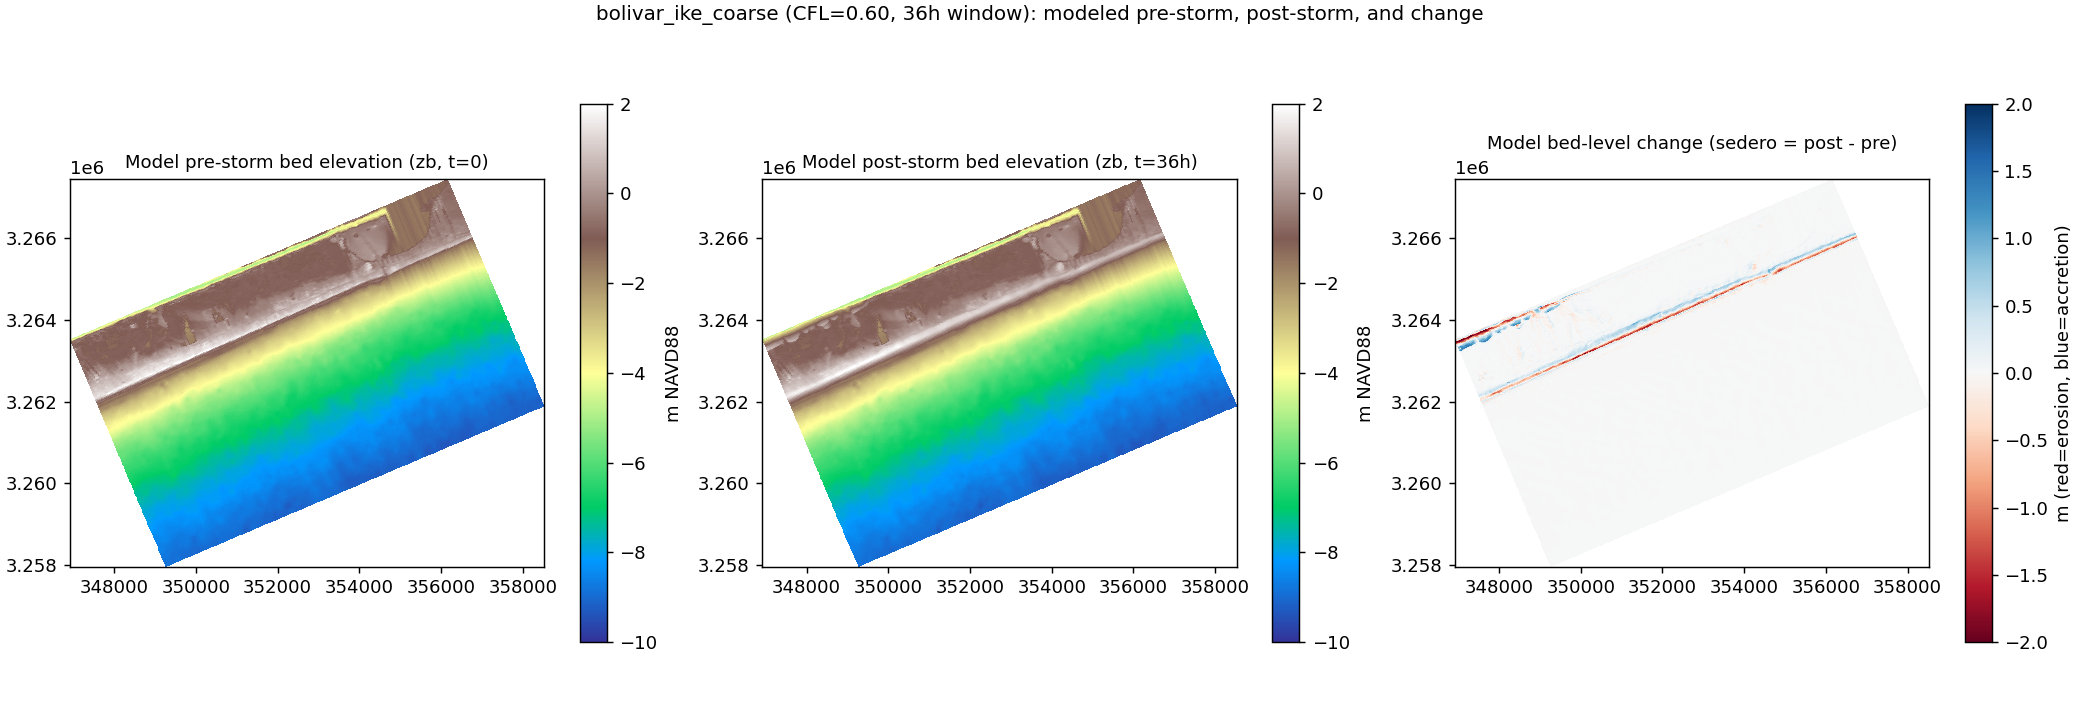
Fig. 2 — Modeled seabed and beach elevation before and after the storm, and the difference between them, across the full model domain. Erosion (red) concentrates in a narrow band right at the beachface, with mild accretion (blue) just behind it.
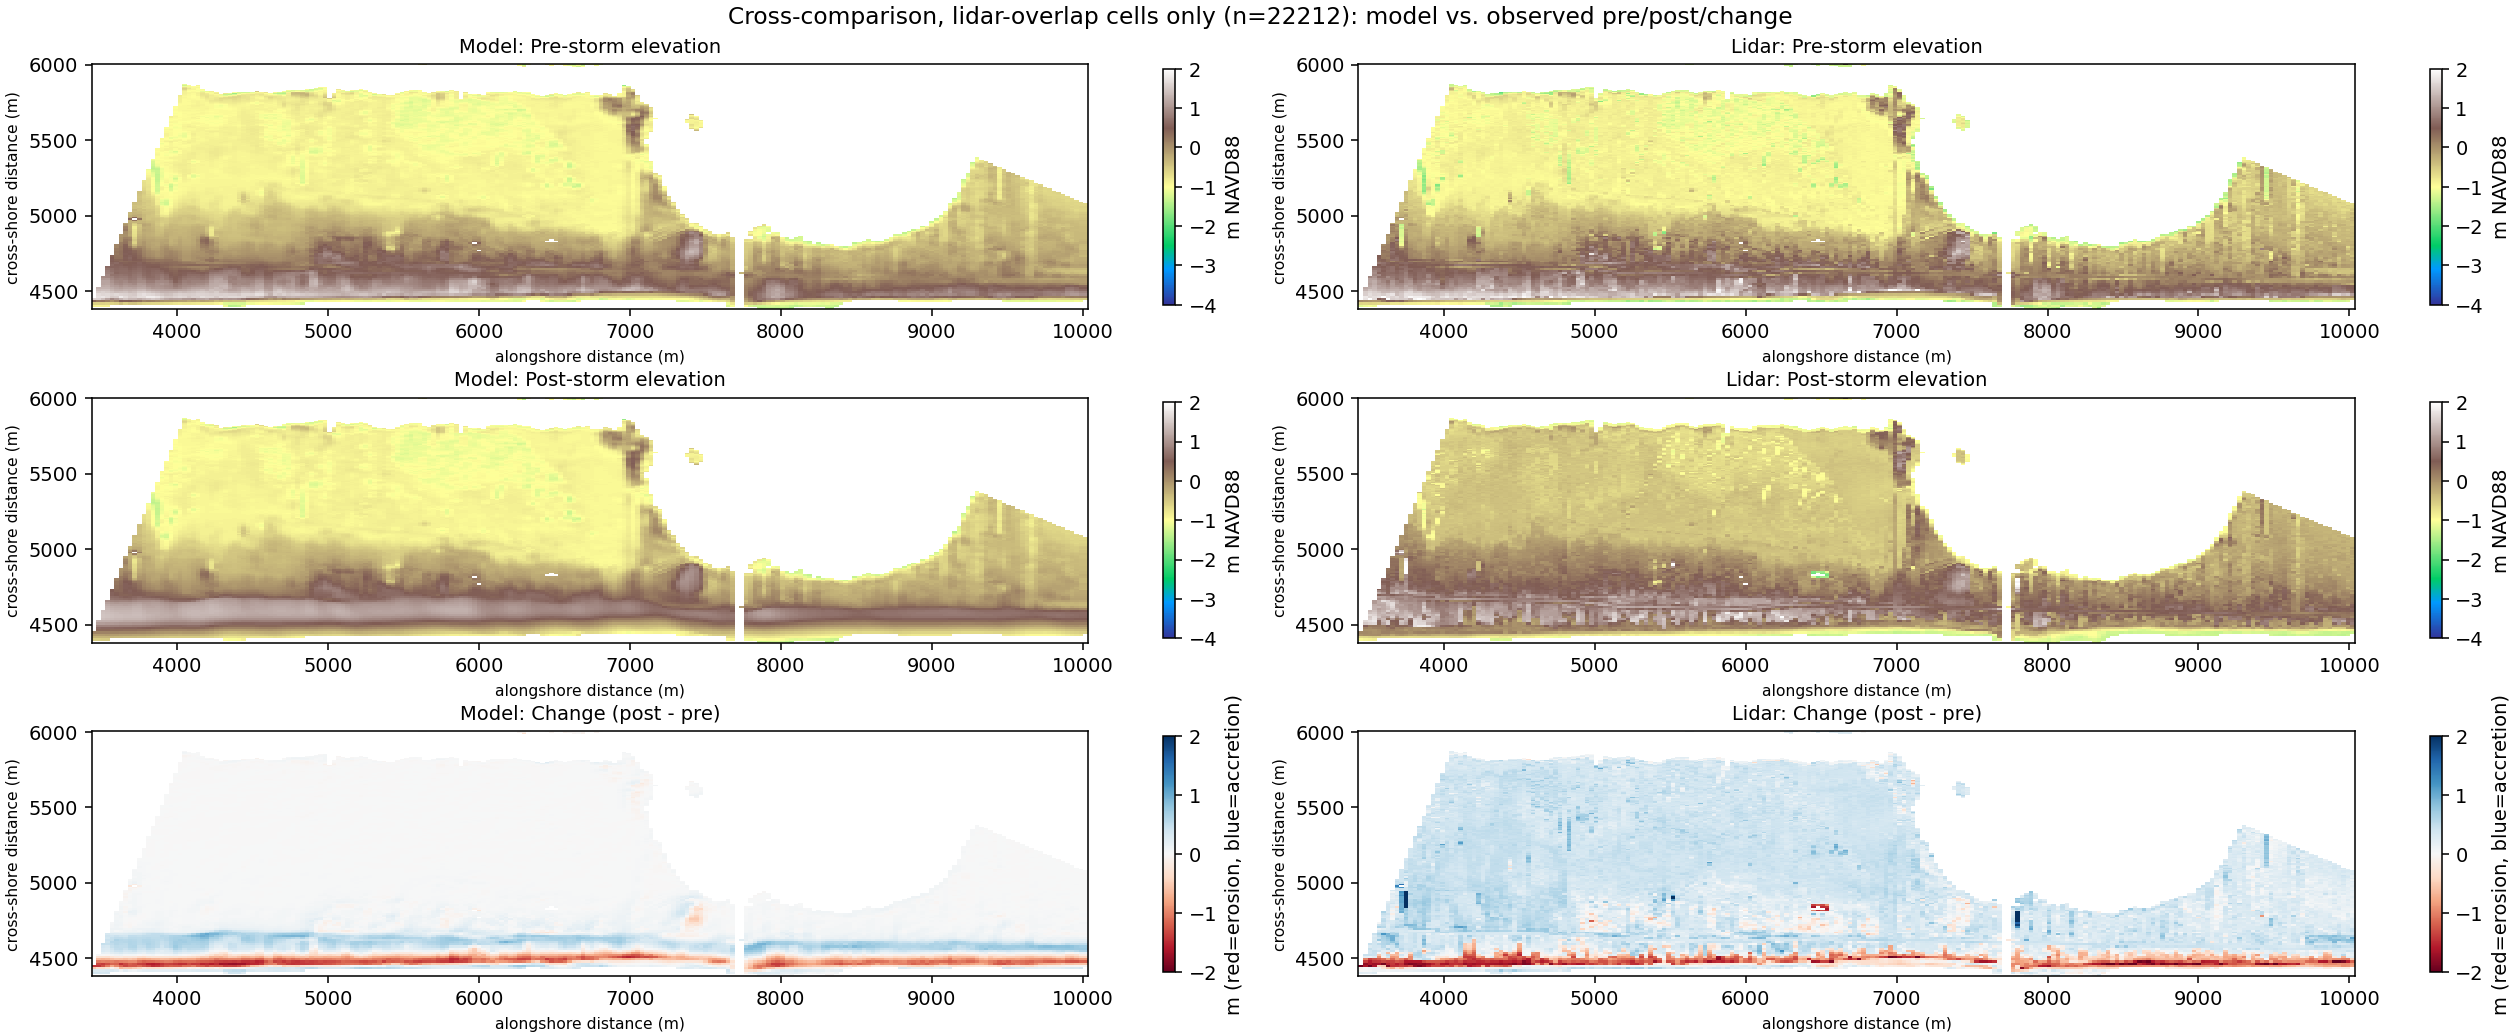 Fig. 3 — Model (left) against the airborne survey record (right), restricted to where the two overlap, drawn at true scale. The model’s before/after pair looks nearly identical since only 36 simulated hours separate them, while the surveys are three years apart and show visibly more accretion — the gap discussed below. The break in coverage midway along the reach is Rollover Pass itself: open water, invisible to an airborne laser survey.
The spatial pattern is genuinely there: both the model and the survey record show the same signature, a narrow erosion band at the beachface with mild accretion just behind it, and the correlation for erosion specifically (0.72–0.73) is solid for an unrefined, untuned test run. The systematic gap in magnitude is expected, not a red flag: the “before” survey was flown roughly two and a half years ahead of the storm and the “after” survey six to twelve months behind it, so the observed change quietly includes years of ordinary background change and post-storm recovery that a 36-hour storm-only simulation was never going to reproduce.
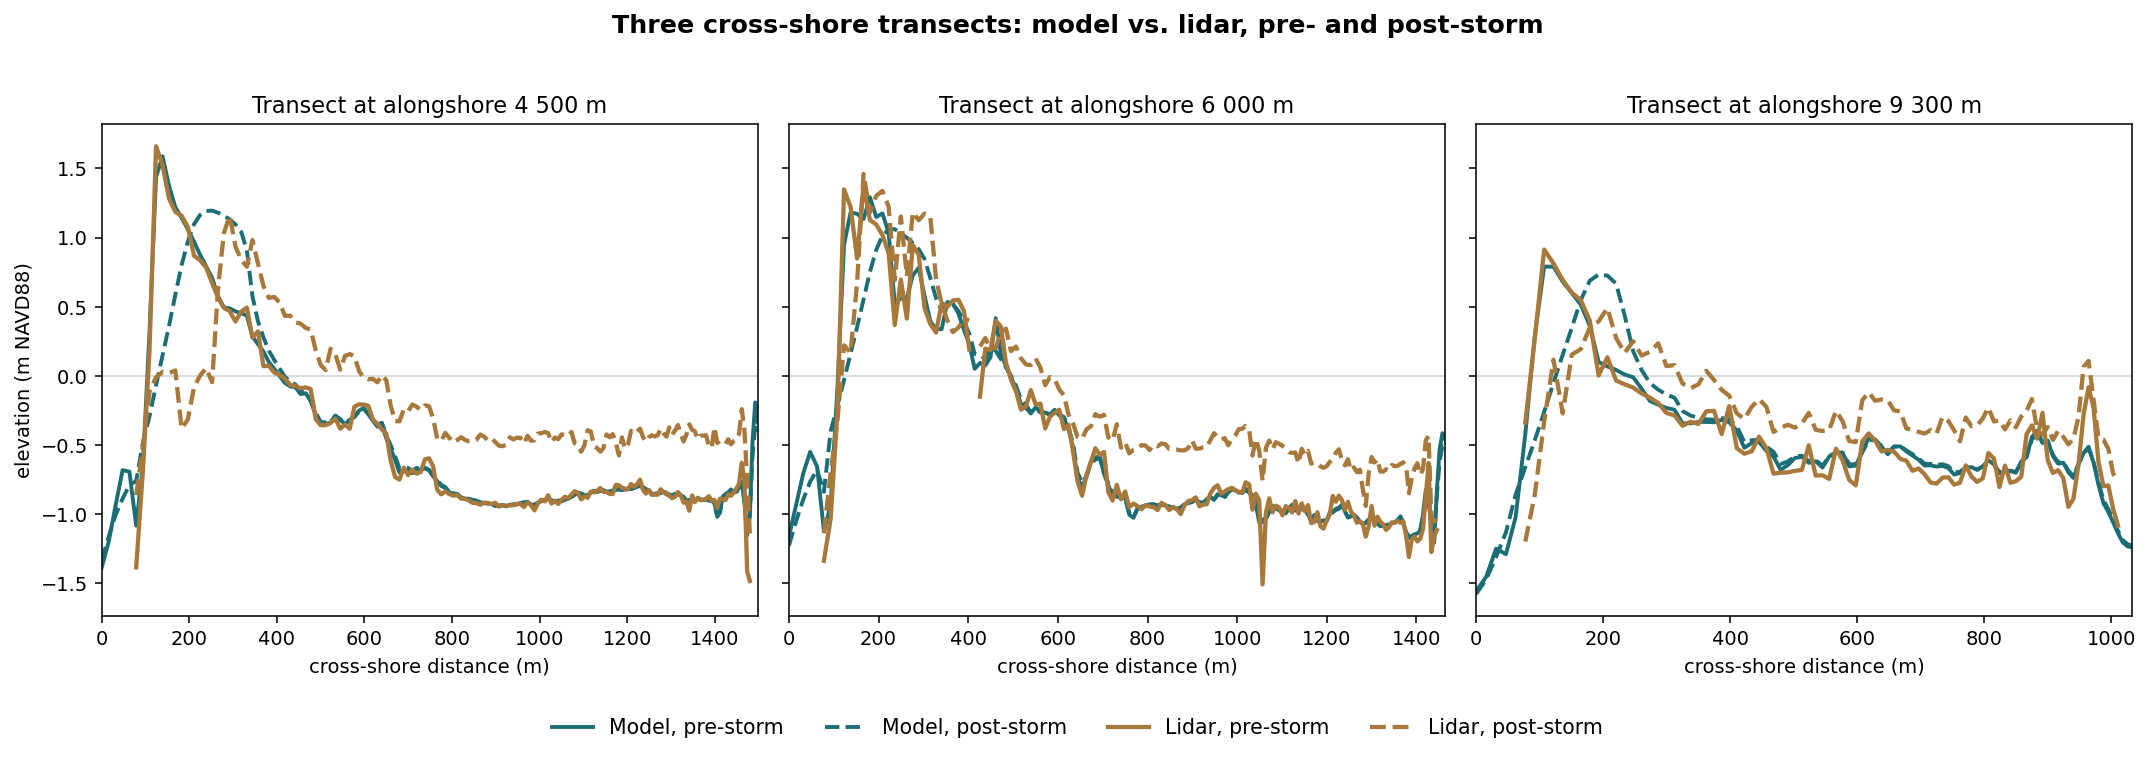 Fig. 4 — The same comparison as a beach engineer would actually read it: three cross-shore profiles spanning the reach, each showing modeled (teal) and surveyed (tan) elevation before (solid) and after (dashed) the storm. Model and survey agree closely on the dune-crest erosion and retreat — the two solid lines and the two dashed lines track each other closely through the crest — but landward of it, the model’s pre/post lines sit almost on top of each other while the survey’s visibly separate. That gap behind the dune is the same accretion the model can’t reproduce, discussed next.
A genuine limitation, not a bug
One part of the comparison disagreed sharply. Tracking down why revealed something true about the model itself, not a mistake in it.
Behind the dune line, the survey record shows meaningful sand accumulation after the storm; the model predicts almost none — roughly 25 times less. The obvious explanation, that this low-lying area simply dried out and stopped participating in the simulation, doesn’t hold up: it stays flooded, with one to several meters of water, for the model’s entire 36-hour run.
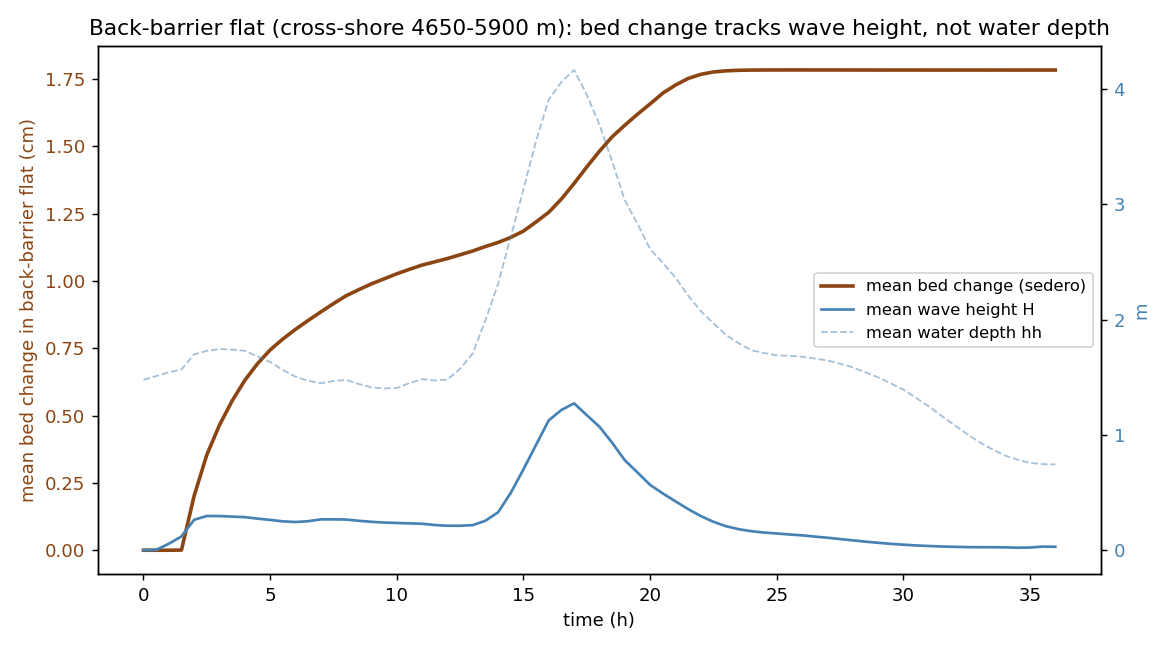 Fig. 5 — Sand accumulation behind the dune (brown) rises only while local wave height (solid blue) is elevated, and flattens out almost exactly as wave height decays — even though standing water (dashed blue) remains for another ten-plus hours.
That flattening is the model behaving correctly, not stalling. XBeach moves sand by keeping it suspended in wave turbulence; once local wave energy dies down behind the dune, there’s simply nothing left stirring sand into the water column, regardless of how much standing water remains. A direct review of the model’s source code confirmed this isn’t a missing switch to flip: wave- and current-driven transport is the whole of what the software does. The gradual, wind-driven accumulation of dry sand — the process that actually rebuilds dunes between storms — is a distinct physical mechanism, handled by different, purpose-built software, and it isn’t represented here at all.
Takeaway. This model, like any storm-hydrodynamics simulation of its kind, should be judged on the beachface erosion it predicts during the storm itself — where it agrees reasonably well with the record — and not on slower dune-rebuilding processes between storms, which are outside what this class of model can do by design.
Where this leaves the project
The fast test version of the model did its job: it validated the data pipeline against a real regional storm hindcast and produced a first, encouraging comparison against independent survey evidence — along with a clear-eyed account of what this kind of model can’t do.
The next step is the full-resolution run this test was built to de-risk: the same storm, the same coastline, at the detail needed for a result that can actually be calibrated against the historical record.
Model: XBeach (Deltares). Storm forcing: a regional SCHISM+WWM hindcast of Hurricane Ike. Elevation surveys: NOAA Digital Coast lidar, 2006 (pre-storm) and 2009 (post-storm).