Wave Model Grid Comparison: Hurricane Harvey (WW3 to SWAN, Structured vs. Unstructured)
A regional WAVEWATCH III model of the Gulf of Mexico run on a structured grid and on an unstructured mesh, each nested into a local SWAN model of Galveston, for Hurricane Harvey and checked against NDBC buoys for wave height, period, direction and wind.
The Challenge
Wave models can run on a regular grid or on an unstructured mesh whose triangles shrink toward the coast. The choice changes what the model can resolve, how long it takes and how it passes boundary conditions to a smaller model nested inside it, but a comparison only means something if the storm, physics, wind forcing and nesting are held fixed and the results are checked against real buoys rather than against each other.
The Approach
Ran WAVEWATCH III over the Gulf of Mexico on a 0.1° structured grid and on a 55,691-node unstructured mesh, both forced by a parametric hurricane wind vortex (GAHM, fit to the HURDAT2 best track) blended with ERA5, and nested each into SWAN on a 28,834-node Galveston mesh through 2D boundary spectra. Scored both grid types against three NDBC buoys (Mid Gulf, Freeport, Galveston) for wave height, peak period, direction and wind speed over the 72 hours around landfall.
The Result
The two grids agree within 3.8% on peak wave height in deep water and 2.5% at the Galveston harbor entrance, and both follow the buoys closely (wave-height correlation 0.79 to 0.98). The structured run took 44 minutes and the unstructured run 176 minutes, 4.0 times longer. The comparison also exposed a depth sign-convention error that had silently marked about 98% of the unstructured mesh as dry, which made it under-predict waves by a factor of 5 to 6 until it was fixed.
Wave models can run on a regular grid or on an unstructured mesh whose triangles get smaller toward the coast. Which one to use depends on the coastline, the runtime budget and how the regional model hands its waves to a local one. To see what the choice actually does, this project holds everything else fixed: the same storm, the same wave physics, the same wind and the same nesting, with the grid type as the only difference.
The setup is a regional WAVEWATCH III (WW3) model of the Gulf of Mexico, run once on a structured grid and once on an unstructured mesh. Each is nested into a local SWAN model of Galveston: WW3 writes 2D wave spectra at 149 points along SWAN’s open boundary, and those spectra become SWAN’s boundary condition. The storm is Hurricane Harvey (2017), which came ashore as a Category 4 near Rockport, Texas, at 03:00 UTC on 26 August, about 280 km southwest of Galveston. The runs cover the 72 hours from 24 to 27 August, driven by the same GAHM parametric vortex blended with ERA5 wind and pressure. The Python workflow that sets up and runs the nested domains is described under Regional and Coastal Wave Modeling.
Two grids, one nest
| WW3 structured | WW3 unstructured | SWAN nest (both) | |
|---|---|---|---|
| Domain | Gulf of Mexico | Gulf of Mexico | Galveston Bay and shelf |
| Discretization | 181 × 131 cells, 0.1° (about 10 km) | 55,691 nodes, 108,734 elements | 28,834 nodes, 50,841 elements |
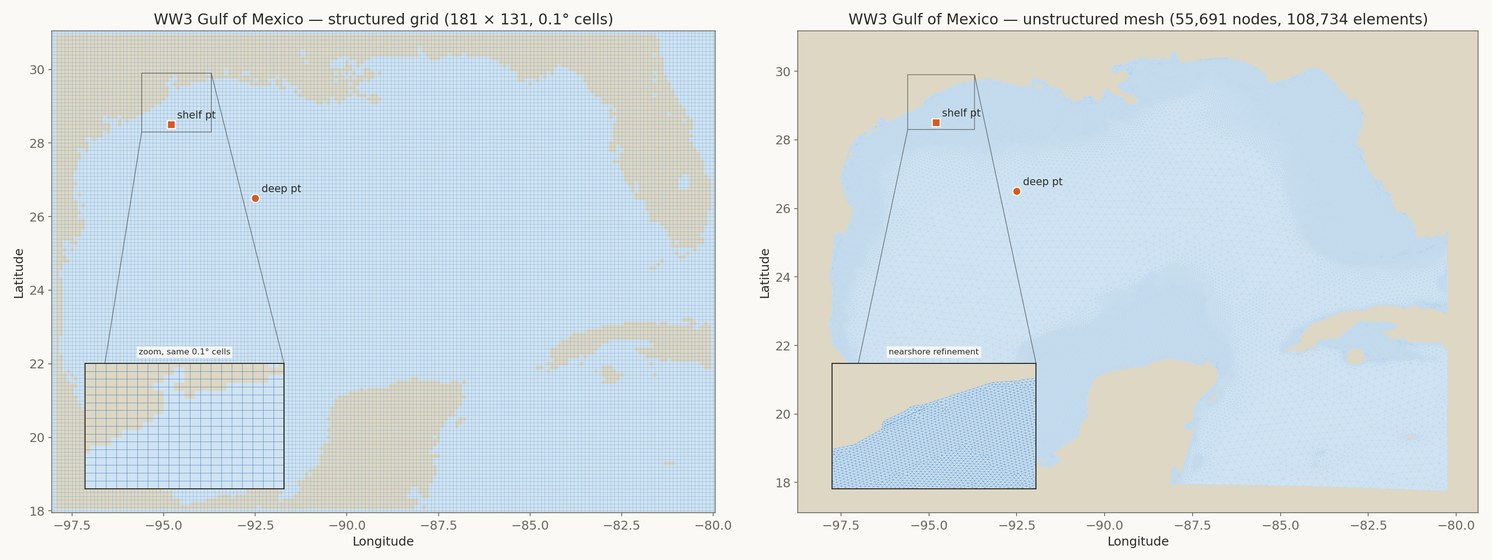
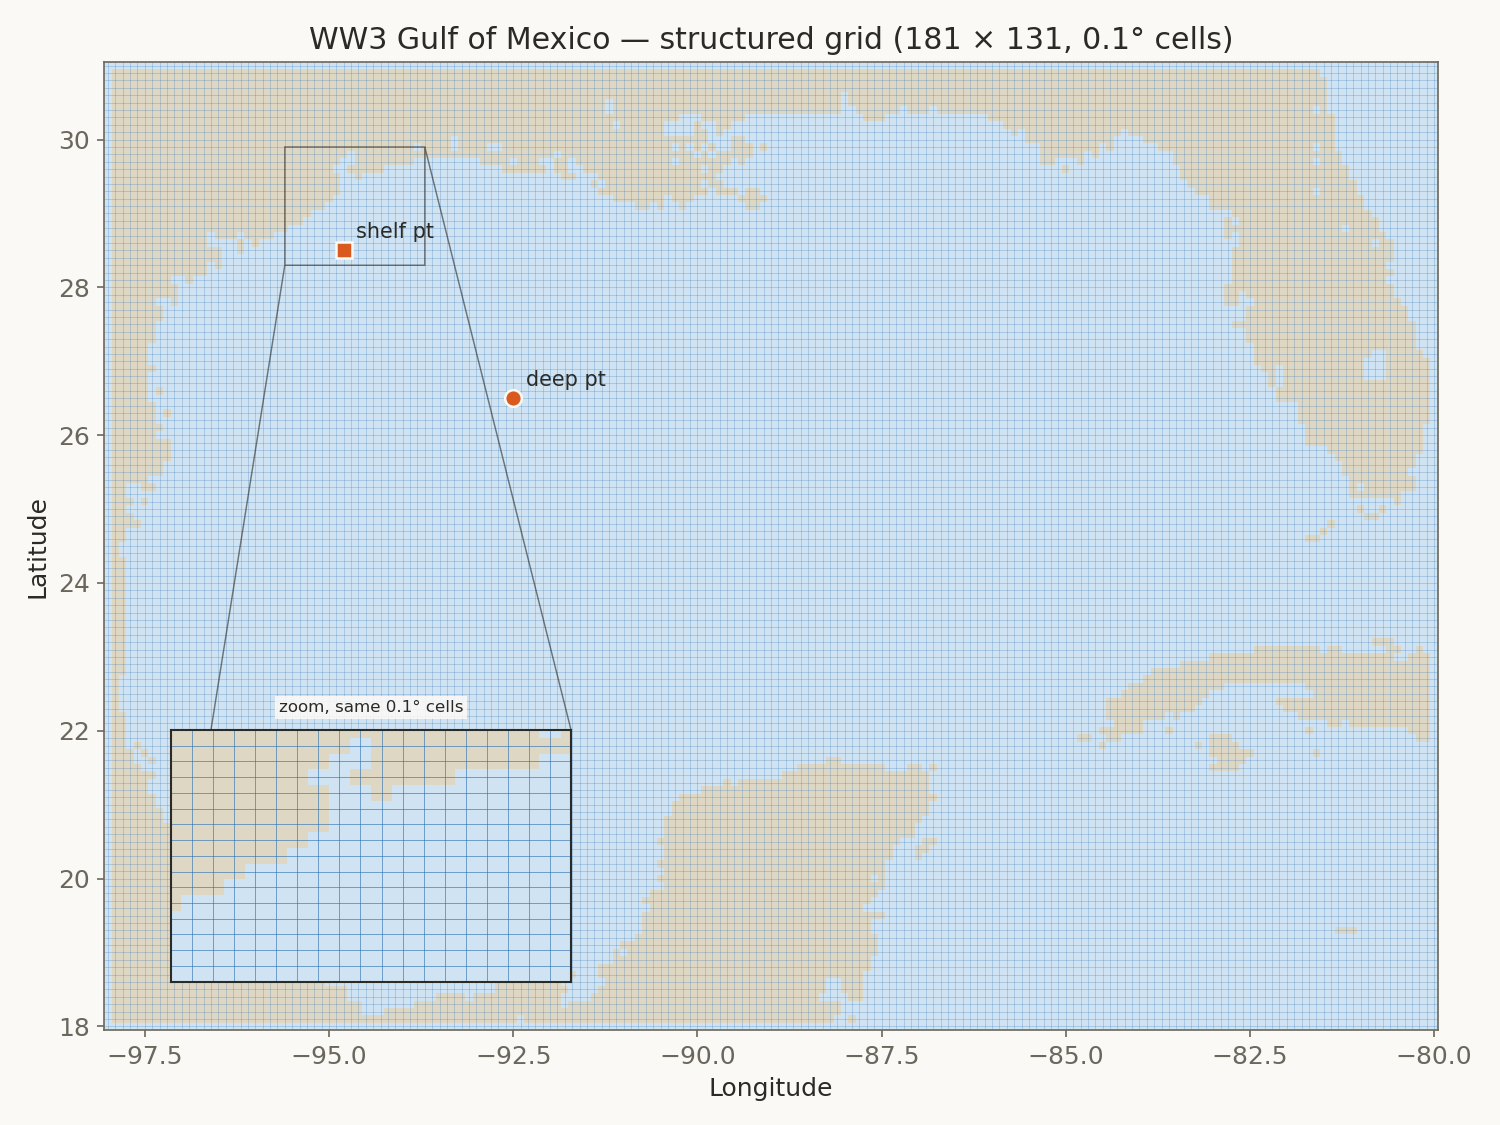 Fig. 1 — The structured WW3 grid, drawn as its actual cell edges.
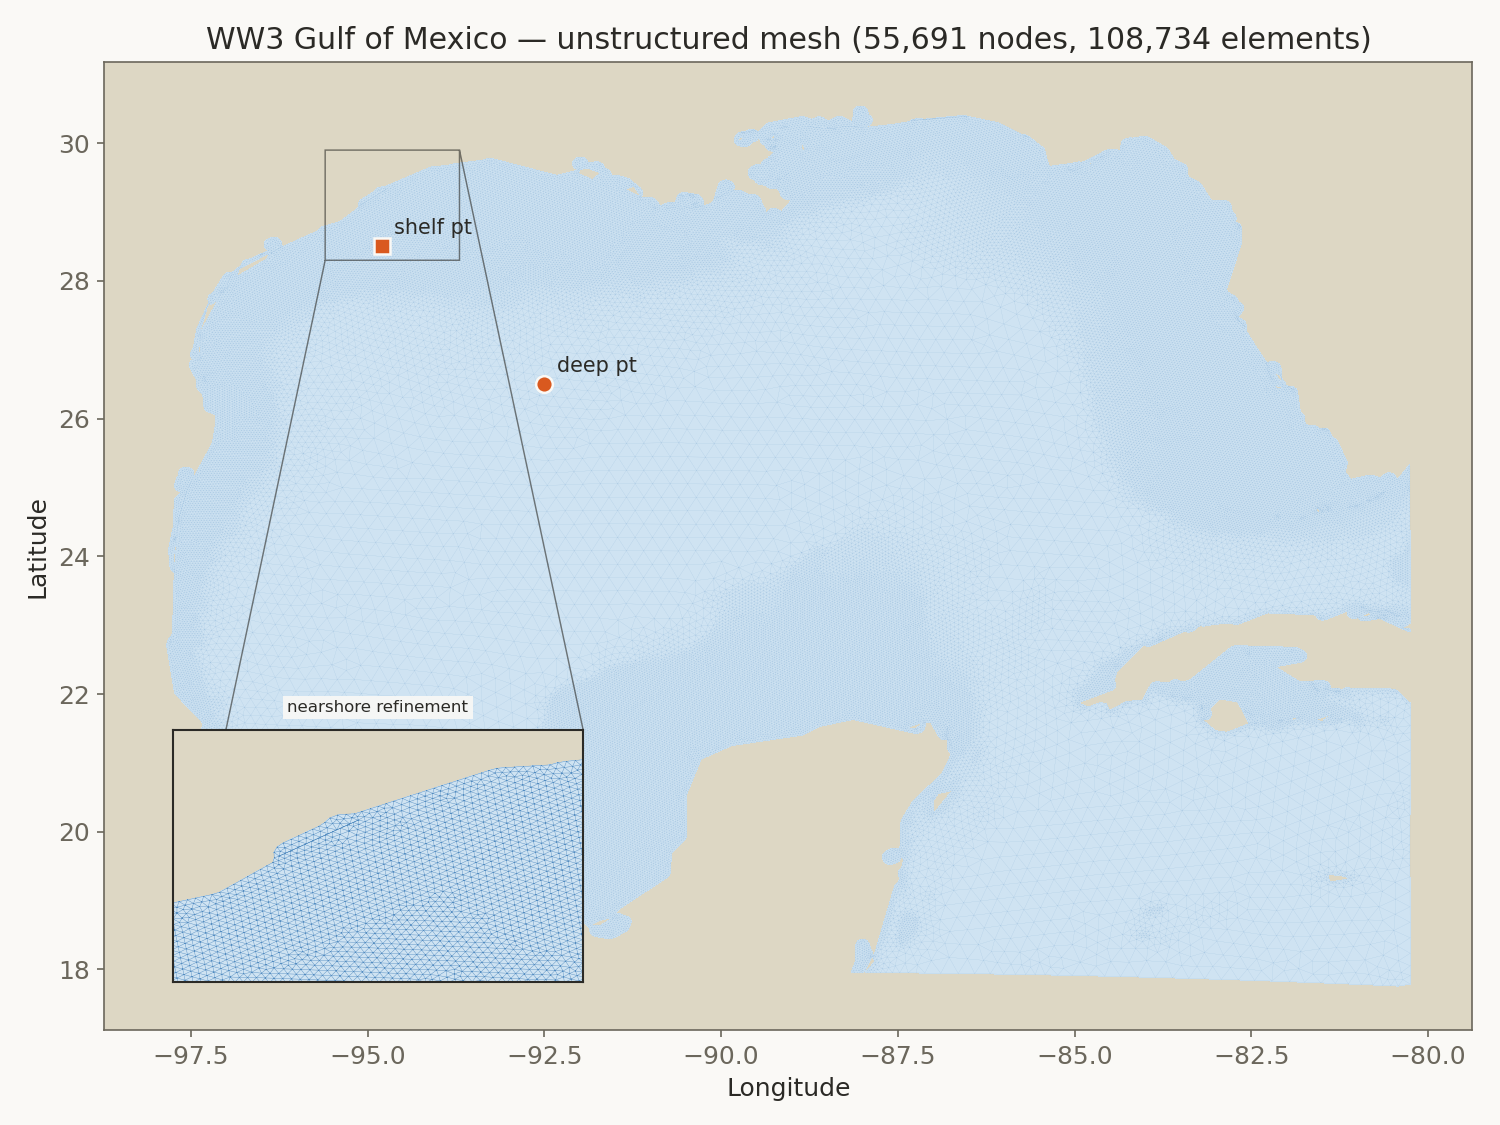 Fig. 2 — The unstructured WW3 mesh, drawn as its actual triangles.
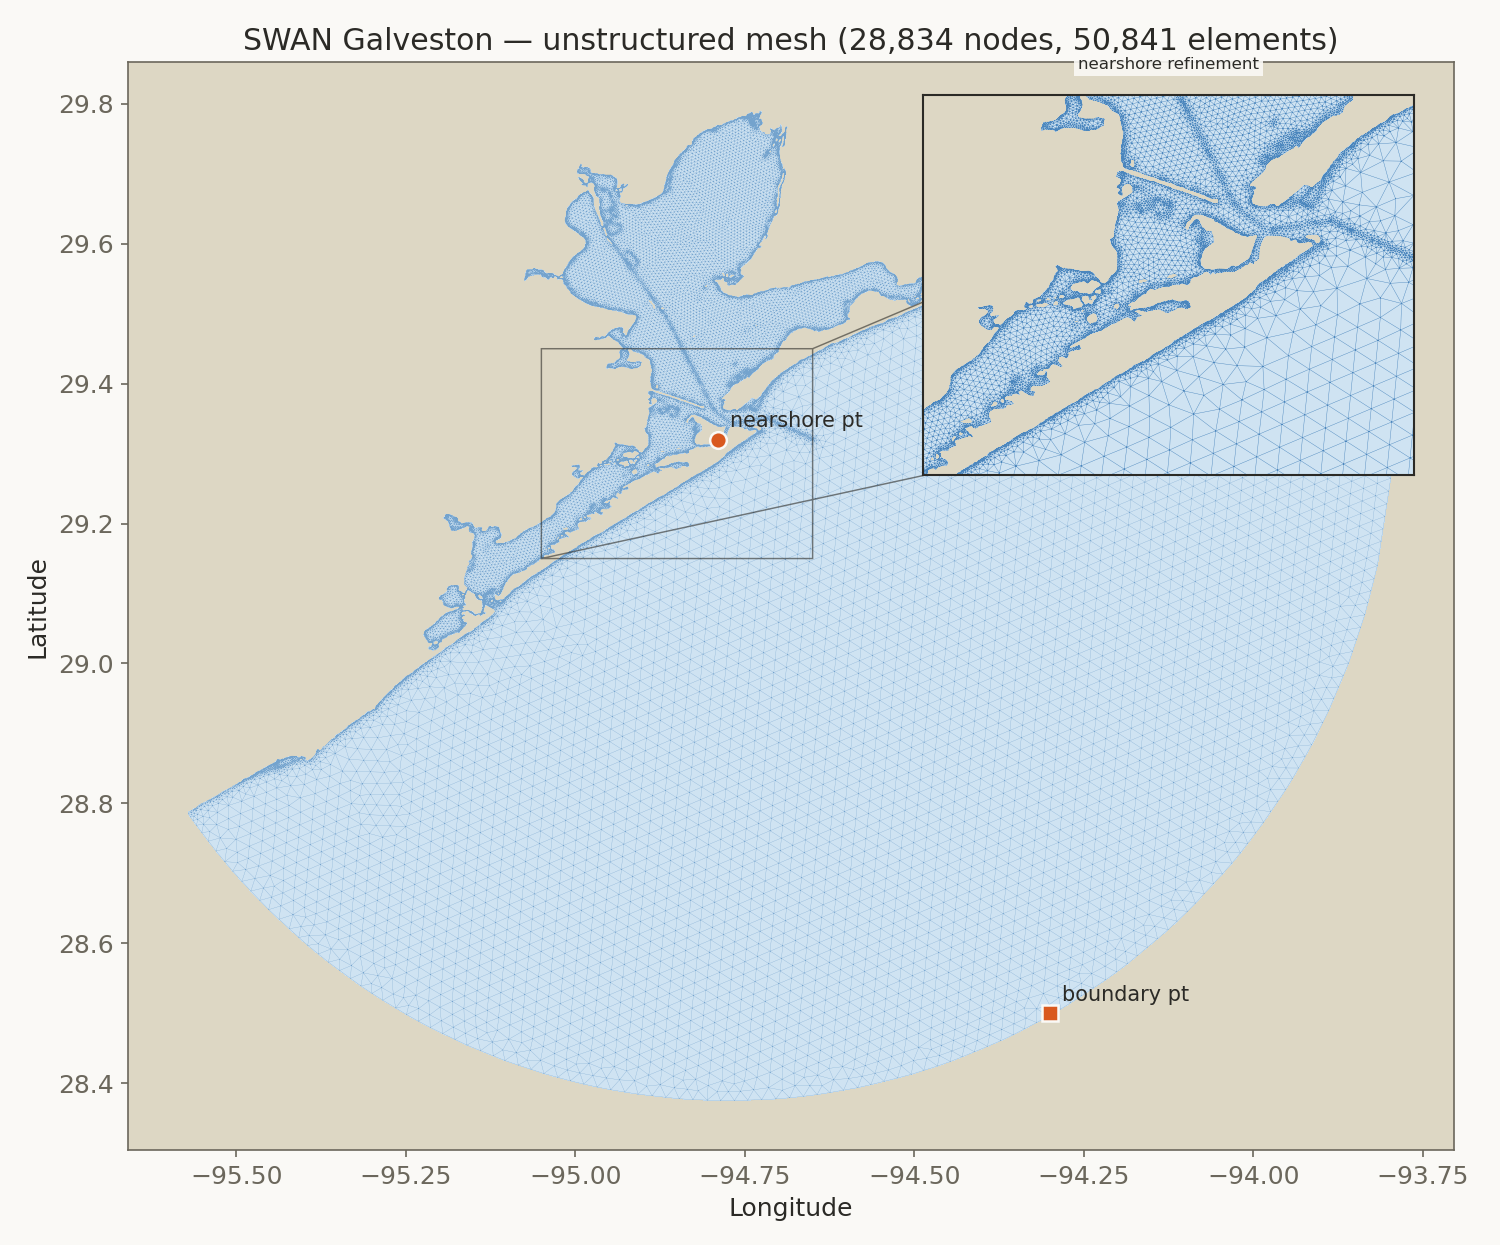 Fig. 3 — The SWAN Galveston nest, the same mesh for both WW3 runs.
What the comparison shows
Peak significant wave height at four locations, from deep Gulf water to the harbor entrance:
| Location | Structured (m) | Unstructured (m) | Difference |
|---|---|---|---|
| Deep water (92.5°W, 26.5°N) | 3.77 | 3.91 | +3.8% |
| Continental shelf (94.5°W, 28.5°N) | 4.79 | 4.98 | +3.8% |
| SWAN open boundary | 3.04 | 3.23 | +6.5% |
| Galveston harbor entrance | 0.95 | 0.97 | +2.5% |
Against the buoys, wave height (Hs) for the two grids:
| Buoy | Structured: corr / RMSE / bias | Unstructured: corr / RMSE / bias |
|---|---|---|
| 42001 Mid Gulf | 0.81 / 0.31 m / −0.11 m | 0.79 / 0.32 m / −0.08 m |
| 42019 Freeport | 0.97 / 0.52 m / −0.01 m | 0.98 / 0.67 m / +0.17 m |
| 42035 Galveston | 0.95 / 0.63 m / −0.54 m | 0.96 / 0.59 m / −0.48 m |
Correlation differs by no more than 0.02 between the grids, and each grid has the lower RMSE at some buoys (structured at two, unstructured at one). The structured WW3 run took 44 minutes and the unstructured run 176 minutes of wall-clock time on the same workstation.
Things worth knowing
- A silent bug that only a comparison finds. The first unstructured runs finished normally but under-predicted waves by a factor of 5 to 6 relative to the structured grid. A depth sign-convention error in the unstructured grid setup had marked about 98% of the mesh’s nodes as dry, so waves were only being computed on a small fraction of the domain. Checking the two grids against each other and against the buoys is what exposed it, and it is why the report states that the numbers above are after that fix.
- Wave direction is the weakest result. Mean direction has RMSE of 30° to 53° across the buoys, and a bias of −36° at Mid Gulf.
- Galveston is slightly under-predicted. Wave height there has a bias of about −0.5 m in both grids.
- The models start cold. Both models begin from zero wave energy at 24 August 12:00 UTC, while the buoys already read 0.6 to 1.4 m of ambient sea. After the first 24 hours the structured-grid Hs bias is −0.01, +0.21 and −0.38 m at the three buoys (RMSE 0.22, 0.48 and 0.45 m), and every statistic in the report includes the early hours.
- Peak period is noisier than wave height. Correlation for peak period is 0.63 to 0.83, and it separates the two grids more than wave height does, because peak period picks a single frequency bin and small spectral differences can shift which bin wins.
The full report
The interactive report has hourly time series of wave height, period, direction and wind at the four locations and three buoys, with bias, RMSE and correlation for every combination: open the full report. A related comparison of two coupled wave and surge models for the same storm is here.