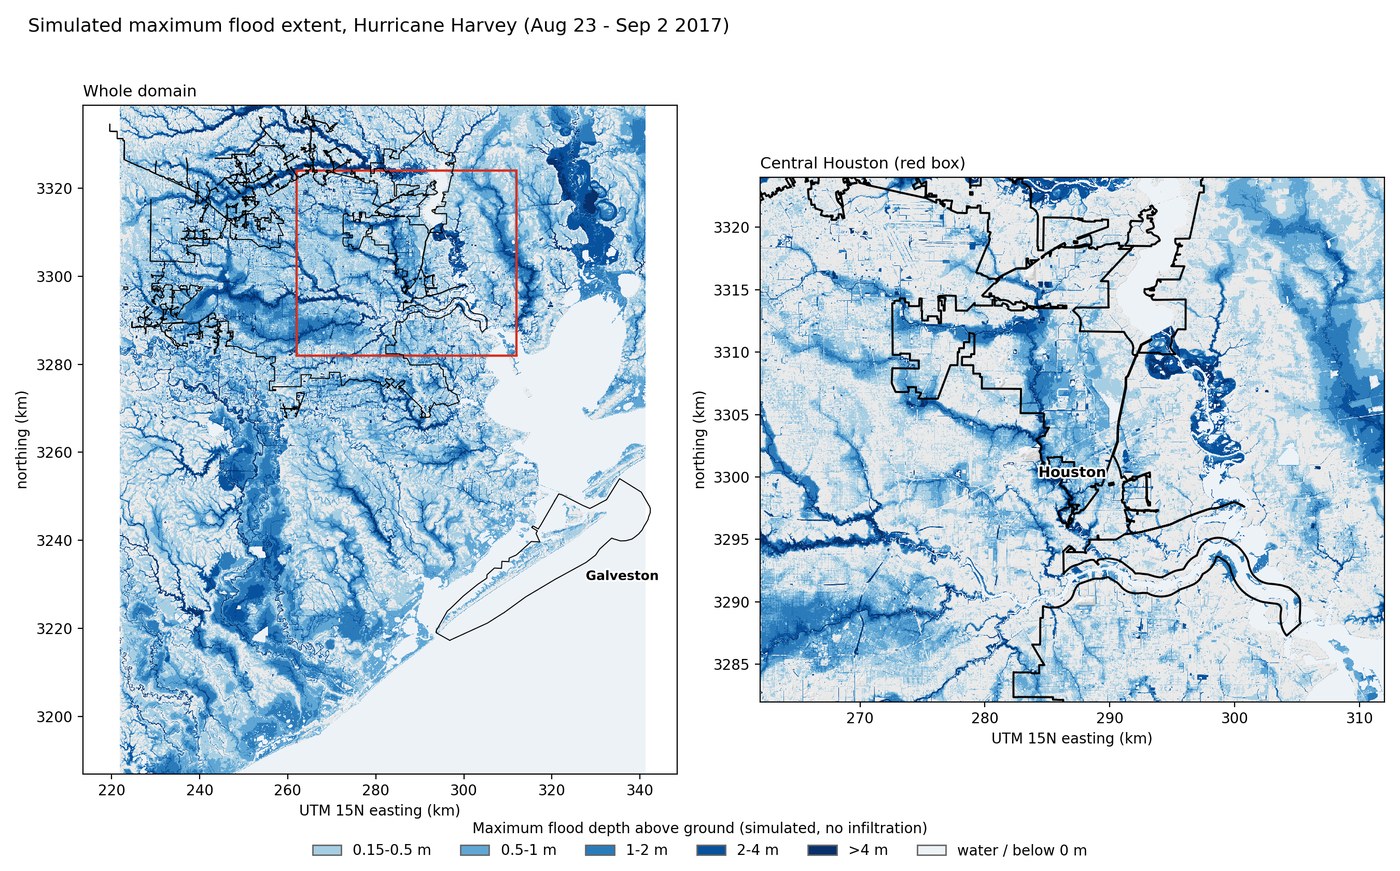
Compound Flood Simulation of Hurricane Harvey in Houston-Galveston (SFINCS)
A 10-day SFINCS compound-flood simulation of Hurricane Harvey over Houston and Galveston Bay, forced by real rainfall, a coastal-surge boundary from my own SCHISM-WWM hindcast and river discharge, and checked against 838 high-water marks, tide stations and stream gauges.
The Challenge
Harvey flooded Houston mainly through extreme rainfall, with storm surge confined to the coast, so a useful flood model has to handle rainfall, river flow and surge together and then be checked against observations inland, where validation data is scarce and easy to misread. A reduced-complexity model like SFINCS makes that practical at event scale, but only if the inputs, the vertical datums and the validation data are all handled carefully.
The Approach
Built the model from public data: 3 m CUDEM and 10 m 3DEP elevation, WorldCover roughness, gauge-corrected MRMS radar rainfall and USGS river discharge. Forced the open Gulf boundary with my own SCHISM-WWM Harvey hindcast, sampled on the boundary cells and corrected to NAVD88, on a 100 m grid with 10 m subgrid pixels. Validated against USGS high-water marks and stream gauges and NOAA tide stations, then ran a series of checks on boundary placement, DEM merge order and subgrid resolution to find what did, and did not, drive the errors.
The Result
Peak water levels at the 838 true high-water marks have a bias of +0.28 m (RMSE 1.87 m), and the three NOAA tide stations agree within 0.32 m. The validation also exposed two things worth knowing: 114 apparent marks along Buffalo Bayou were surveyed a week or more after the peak and are not comparable, and the model has no infiltration, so it runs about 2 m high along Buffalo and Whiteoak Bayous and its flood extent is an upper bound.
Hurricane Harvey stalled over Texas in late August 2017 and dropped rainfall on the Houston area that averaged 626 mm over this model’s domain during the event, with a maximum of 1,197 mm. Flooding from an event like that has several sources at once: rain falling on the ground, rivers and bayous overtopping, and storm surge pushing water into the bays. When they overlap the result is called compound flooding.
SFINCS (Super-Fast INundation of CoastS) is a reduced-complexity flood model from Deltares. It solves simplified flow equations on a grid with subgrid terrain tables, which makes a 10-day, 1.8-million-cell simulation practical on a single workstation: the final run took 2 h 39 min on 24 threads. This project builds a full Harvey model for Houston-Galveston from public data plus my own coastal hindcast, runs it, and tests it against every kind of observation available.
How much of the flooding could surge explain?
Before running anything, a simple check on the elevation data shows where surge could have reached. Counting land below 1.3 m NAVD88 (slightly above the 1.14–1.25 m peaks observed at the tide stations) that is connected to the bay gives about 729 km² of the domain’s land (5.5%), and only 1.7 km² inside the City of Houston limits (0.1%). Allowing 2 m or 3 m for wave setup and uncertainty raises that to 8.5% and 12.5% of land, but still under 1% of Houston. This bathtub estimate ignores friction and duration, so it is an upper bound, and it is the reason rainfall has to be treated as the main driver for most of the city.
Model setup
| Input | Source | Detail |
|---|---|---|
| Elevation, coastal | NOAA CUDEM 1/9 arc-second | ~3 m tiles, plus a ~10 m 1/3 arc-second strip for the Gulf south of 29.05°N |
| Elevation, inland | USGS 3DEP | 10 m; only fills gaps, and CUDEM covers the whole model grid |
| Roughness | ESA WorldCover 10 m | Manning’s n by land-cover class |
| Rainfall | NOAA MRMS gauge-corrected radar | Hourly, 240 h (Aug 23 – Sep 2 2017) |
| Coastal water level | My SCHISM-WWM Harvey hindcast | 12 points on the open-boundary cells, corrected to NAVD88 |
| River discharge | USGS 08067000, Trinity River at Liberty | Peak 3,568 m³/s (126,000 cfs) |
The domain covers Harris County, Galveston Bay and the Gulf shelf out to 28.80°N, on a 100 m grid (1,193 × 1,519 cells, UTM 15N) with 10 m subgrid pixels that hold the terrain detail inside each cell.
The coastal boundary
The surge enters through the open Gulf boundary. Rather than forcing it at tide gauges inside the bay, the boundary cells that SFINCS actually builds are thinned to about one point per 10 km, and my own coupled SCHISM+WWM hindcast is sampled at the nearest mesh node to each. SCHISM’s water level is relative to its own mesh datum, so a single offset (NOAA NAVD88 minus SCHISM over a pre-storm window, +0.44 m, the mean of four stations that spread 0.38–0.53 m) puts it on the datum the rest of the model uses. There is no NAVD88 gauge offshore, so one offset for the whole boundary is an assumption.
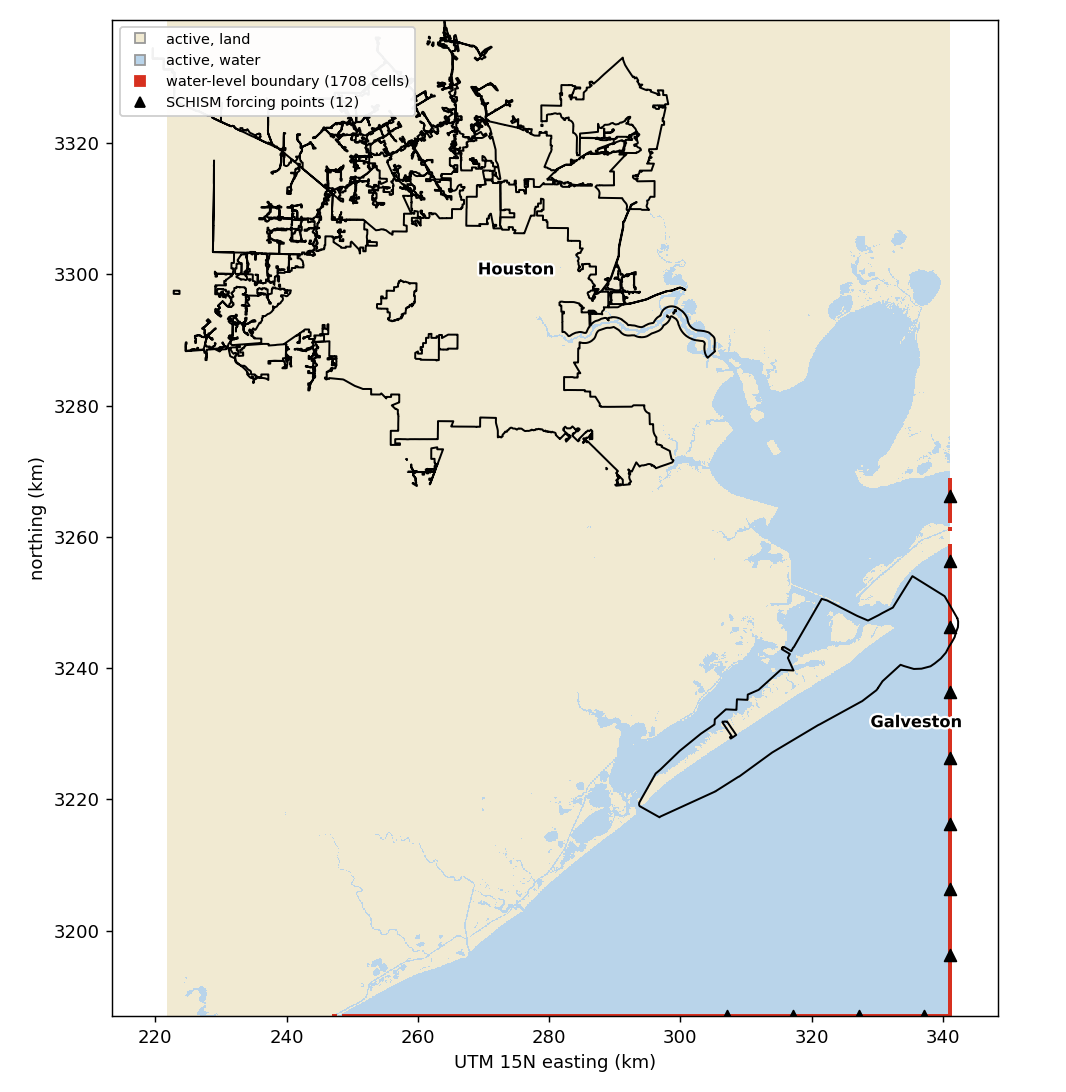 Fig. 1 — The model domain. Red marks the 1,708 water-level boundary cells along the Gulf-facing south and east edges; triangles are the 12 SCHISM forcing points. Black outlines are the Houston and Galveston city limits.
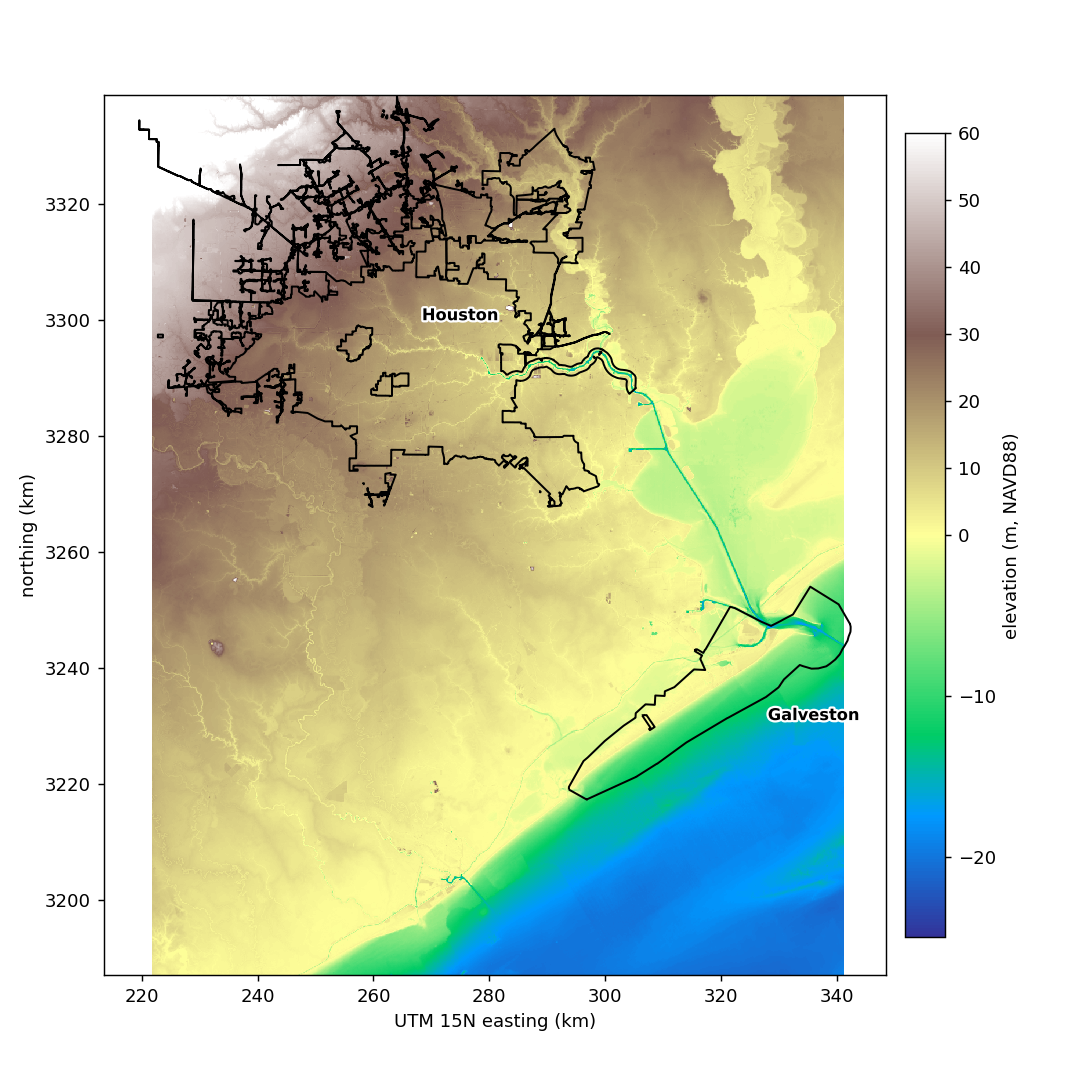 Fig. 2 — Merged elevation (m, NAVD88). The domain reaches about 25 km south of Galveston Island into open Gulf water.
Simulated flood extent
The model writes a peak water level on its 100 m grid but no depth above ground, so depth is computed by downscaling that level onto a 25 m DEM built from the same elevation sources, and shown where it is at least 0.15 m.
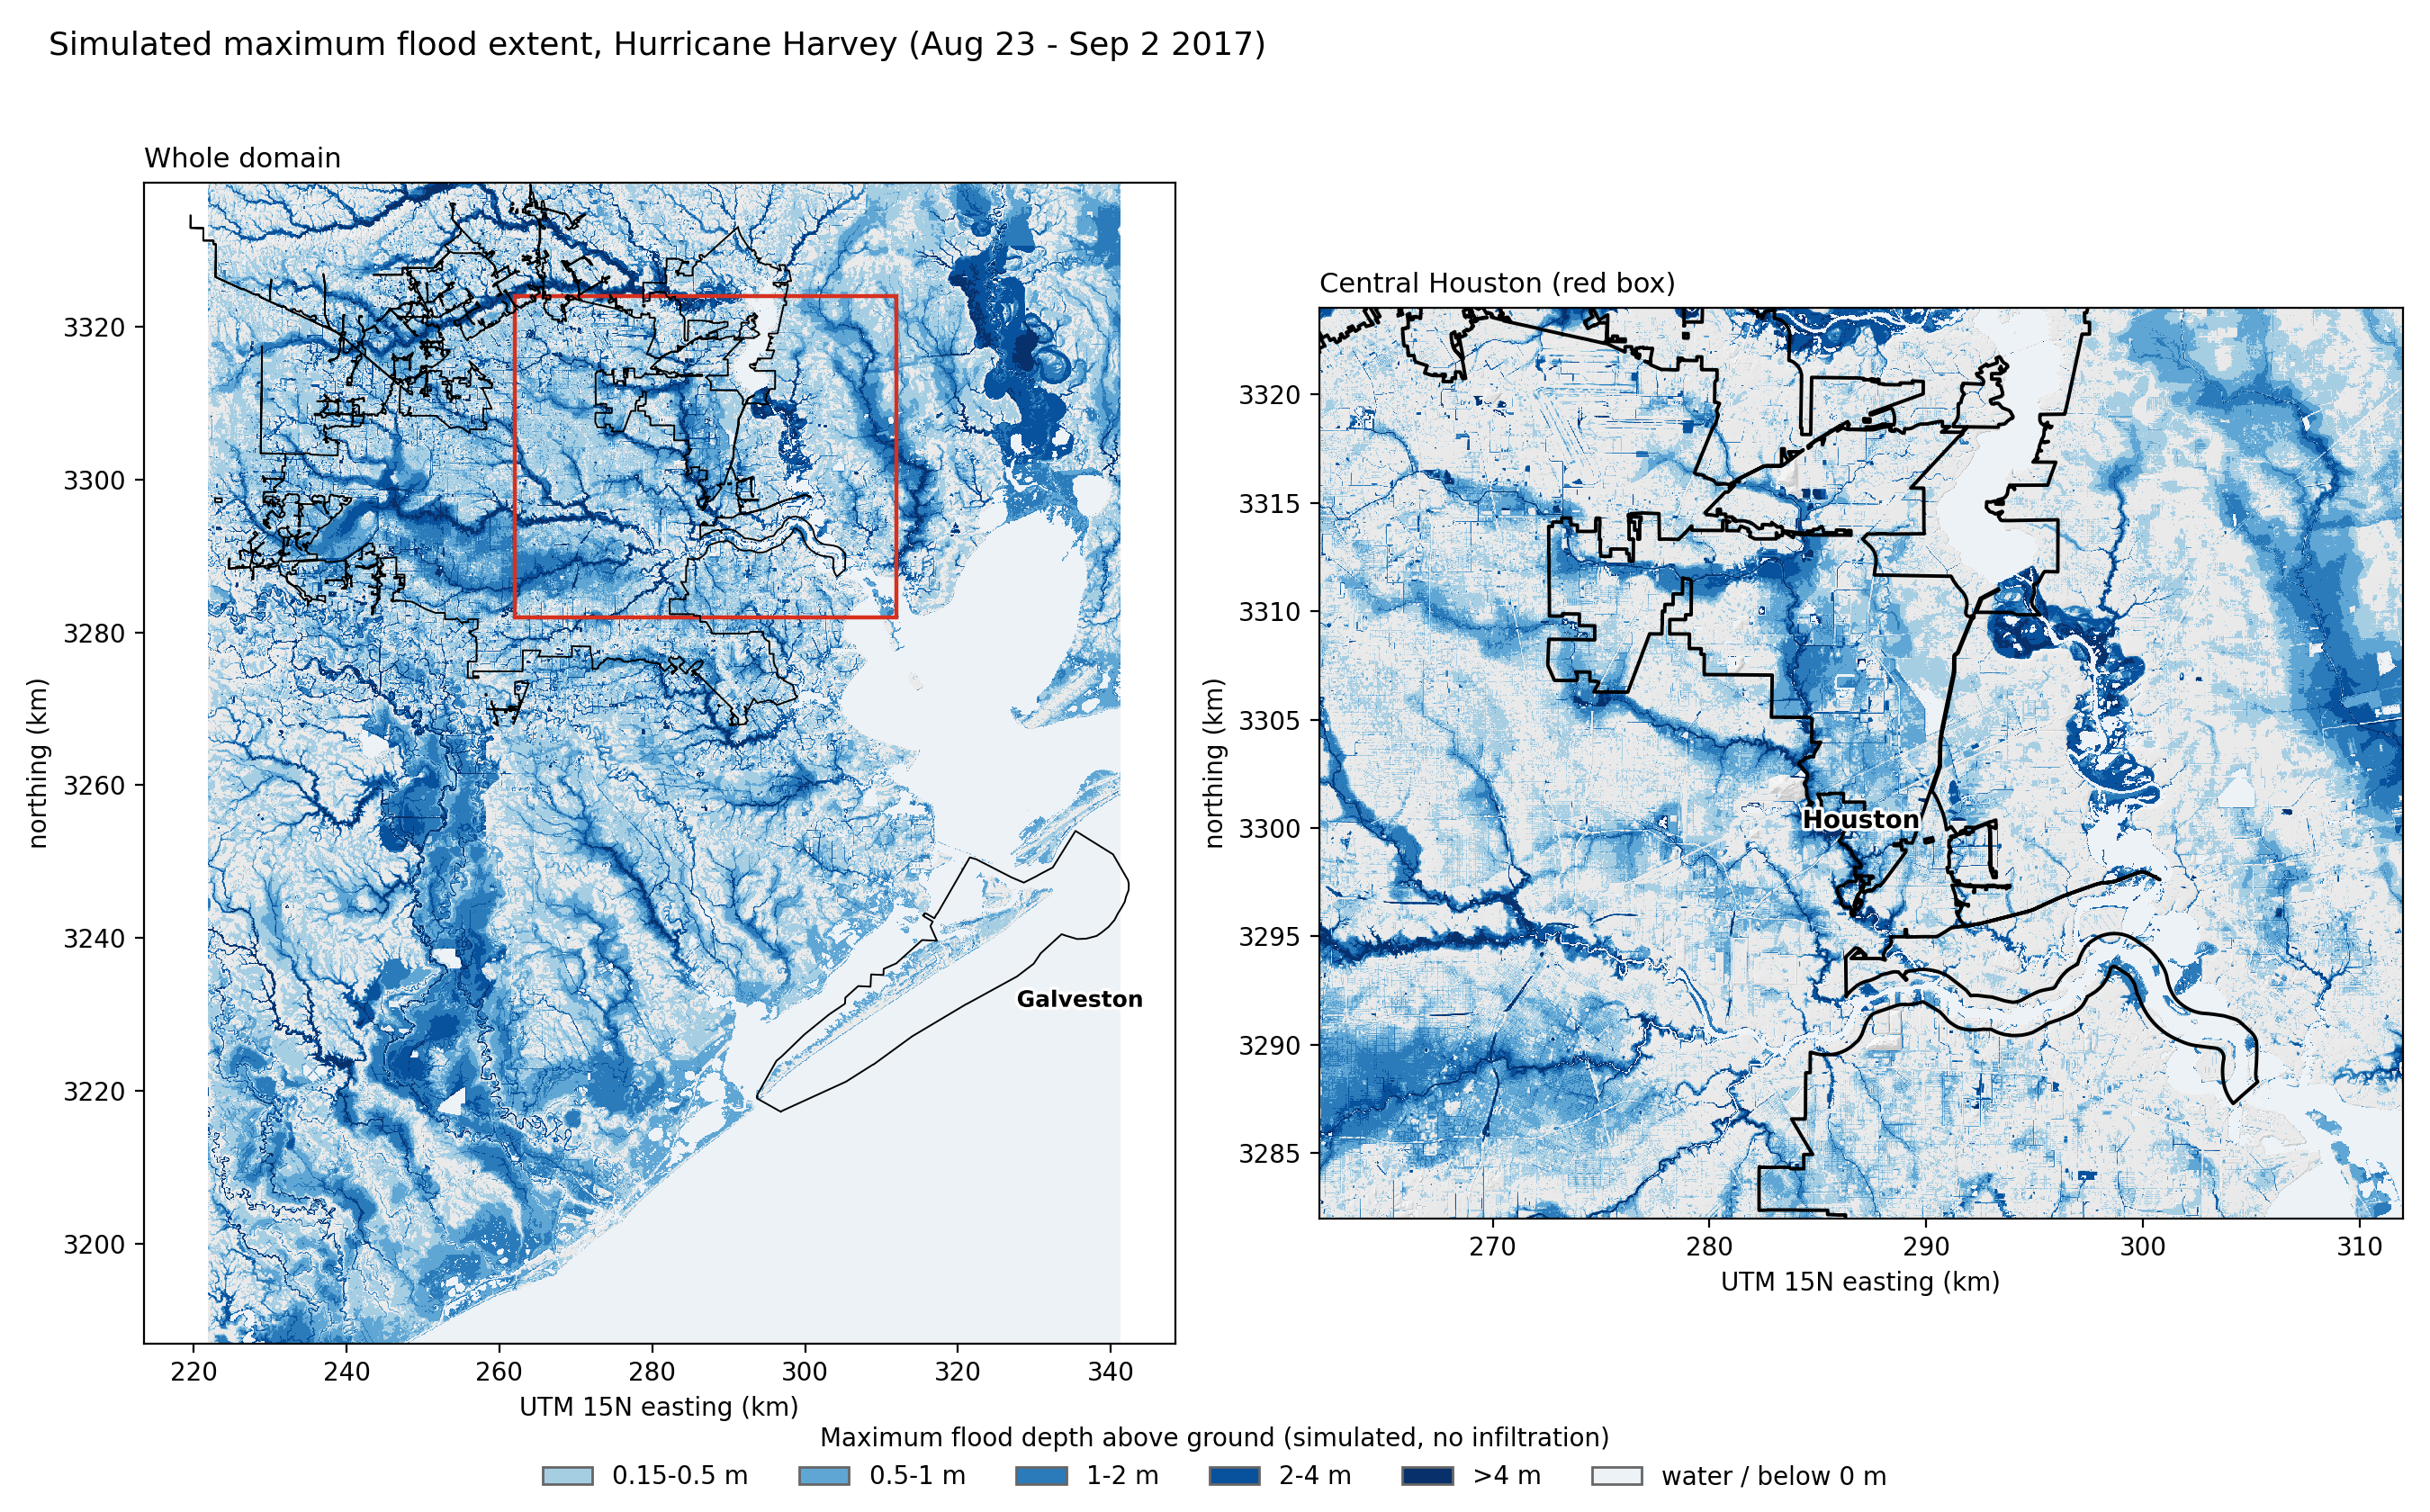 Fig. 3 — Simulated maximum flood depth (click for the full-size map). Flooded area by depth: 0.15–0.5 m, 2,950 km²; 0.5–1 m, 1,780 km²; 1–2 m, 1,125 km²; 2–4 m, 520 km²; over 4 m, 140 km².
This map is an upper bound. The model applies all of the rainfall as runoff, with no infiltration and no storm drainage, so the flat coastal plain ponds water almost everywhere: 49% of the domain’s land and 50% of the City of Houston come out flooded, and 16% of Houston at 1 m or more. The pattern along the bayous matters more than the shallow 0.15–0.5 m fringe, which is the part most likely to be an artifact.
Testing against observations
High-water marks. Against the 838 USGS peak high-water marks, absolute NAVD88 elevation has a bias of +0.28 m, MAE 1.01 m and RMSE 1.87 m. Galveston and Chambers counties, nearest the coast, have biases of +0.05 m and +0.29 m.
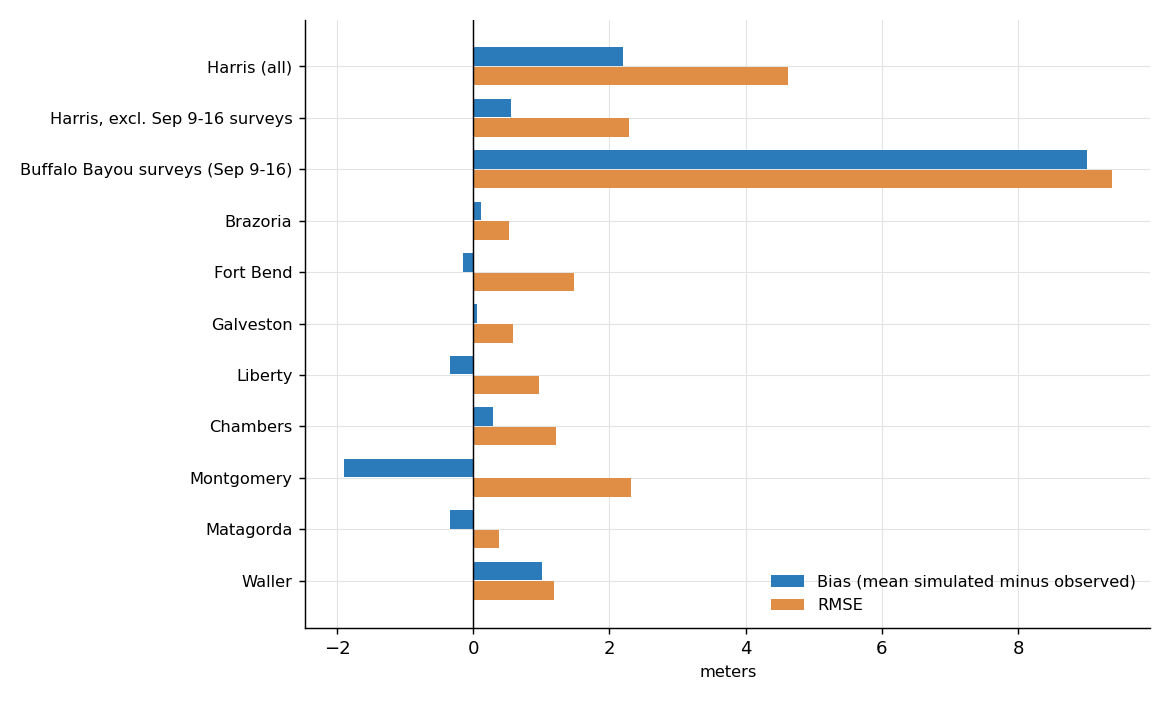 Fig. 4 — Error by county. Harris County is split because 114 of its marks turned out not to be peak marks (below).
Tide stations. The three NOAA stations are on NAVD88 and give the cleanest check: the simulated peak is 1.01 m against 1.16 m at Galveston Pier 21 (−0.15 m), 1.13 against 1.25 m at Eagle Point (−0.12 m) and 0.82 against 1.14 m at Freeport (−0.32 m). The SCHISM offset was fitted on a pre-storm window at four bay stations, so this is a consistency check rather than an independent one.
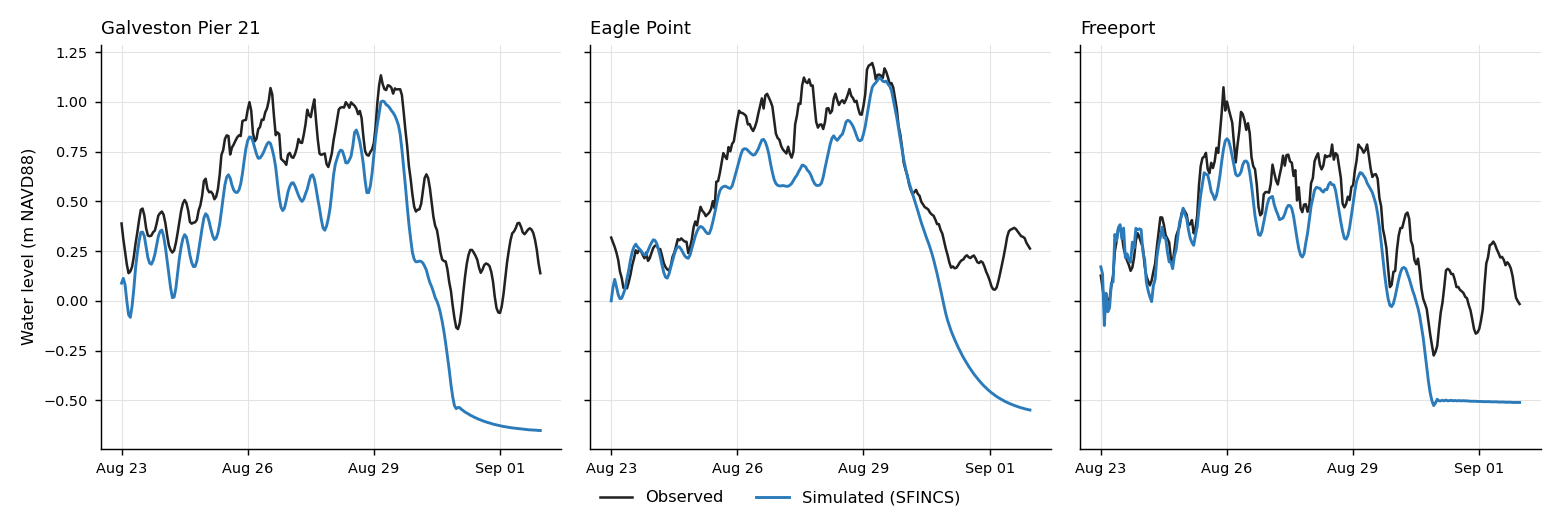 Fig. 5 — Hourly water level at the three tide stations. From about Aug 30 the simulated level falls below the observed one and is then held flat, because the SCHISM series ends on Aug 31, so the tail is not a fair comparison.
Stream gauges. Along the Buffalo Bayou gauges, simulated peaks run high: +0.8 m near Katy, +1.7 m at SH 6, +2.3 m at W Belt Dr, +2.2 m at Whiteoak Bayou at Main St and +1.8 m at the Turning Basin. USGS stage is on each gauge’s own datum, so those levels are a timing and shape check more than an elevation one.
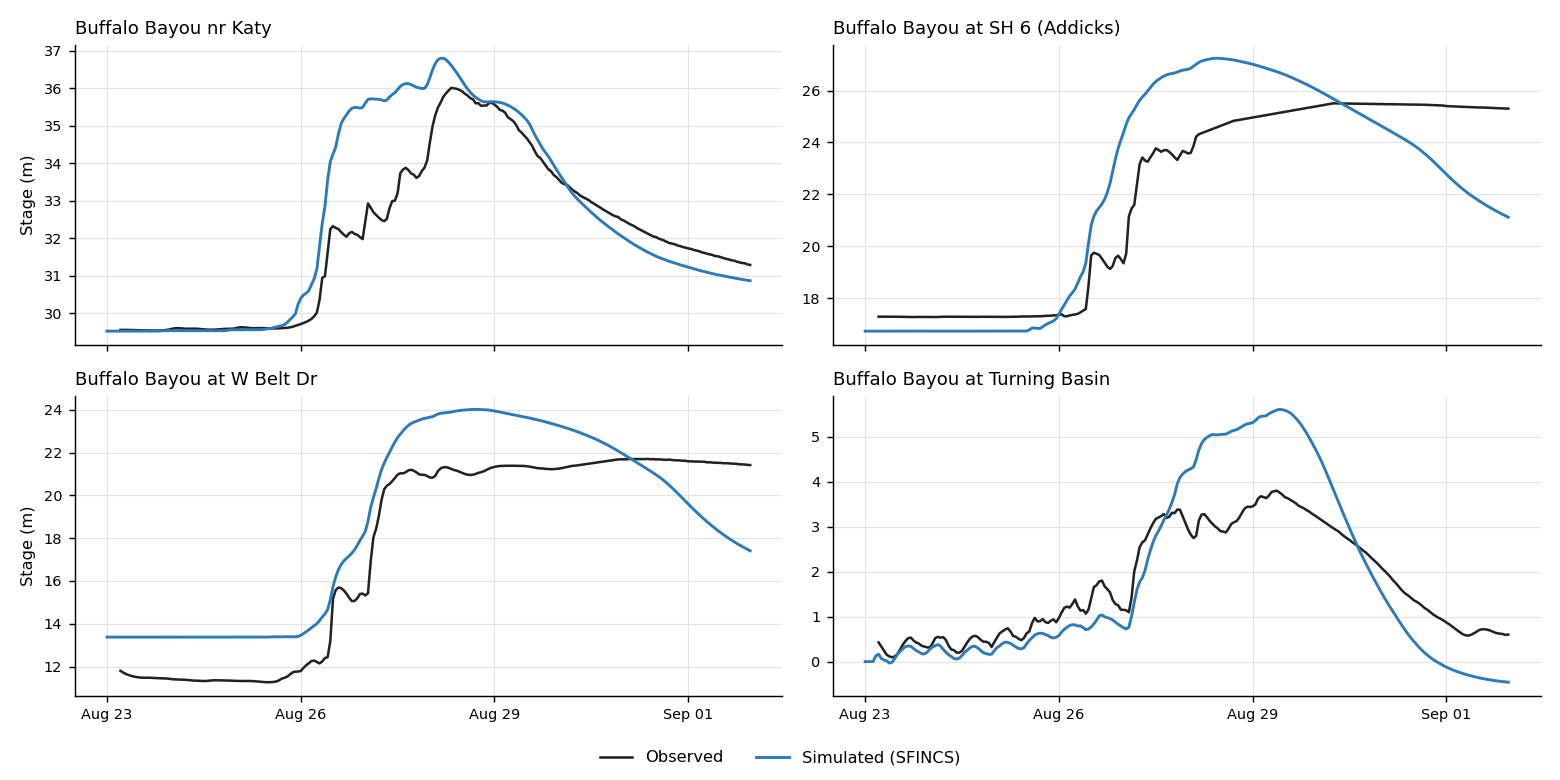 Fig. 6 — Stage at four Buffalo Bayou gauges. The two gauges in the Addicks/Barker reservoir area show observed stage plateauing for days while the model peaks and recedes: SFINCS has no reservoir operations.
A validation trap: 114 marks that are not peaks
Harris County looked poor at first (bias +2.20 m, RMSE 4.62 m), and all of it came from one cluster. 114 of its high-water marks are USACE water-surface points at Buffalo Bayou bridges whose own descriptions say the levels were measured on selected days from Sep 9 to Sep 16, one to two weeks after the peak and after this simulation ends. They are stages on a receding bayou, not peak marks, and compared with the simulated peak they show a meaningless +9 m error.
The gauges show what actually happened. Whiteoak Bayou at Main St, 0.3 km from the Milam St mark, peaked at 11.6 m on Aug 27 and had fallen to 3.4 m by Sep 3; the survey there, taken Sep 9–16, reads 1.1 m, the same recession continuing. The model peaks at 13.8 m on Aug 28, so the real overshoot is about 2 m, not 9 m. Without the 114 surveys, the remaining 838 marks give the +0.28 m bias above.
What the checks ruled out
- The DEM. CUDEM (3 m) covers all 114 locations and takes precedence over 3DEP, and moving from 25 m to 10 m subgrid pixels changed simulated levels at those points by only −0.06 m on average.
- The coastal boundary. Moving the boundary into open Gulf water, and padding the input rasters so the grid corners have real elevation, changed headline skill by no more than about 0.1 m; what they bought was a physically sound boundary and checkable tide stations.
- A merge-order trap. 3DEP, a land-only product, returns a fake flat 0.0 m over water. Listed ahead of CUDEM it overrode real bathymetry and collapsed the open boundary to a few cells in the wrong place, so CUDEM has to come first.
Limits
The largest known gap is infiltration: with no infiltration or storm drainage the flood extent is an upper bound, and it is the leading untested candidate for the ~2 m overshoot along Buffalo and Whiteoak Bayous. Other candidates are the missing Addicks/Barker reservoir operations, the 100 m base grid and the rainfall input. Other limits: only the Trinity River has an inflow boundary, so the San Jacinto forks are unforced (plausibly why Montgomery County is underpredicted by 1.9 m); the domain’s eastern edge cuts off the eastern part of East Bay, though error near that edge is no worse than elsewhere; and the SCHISM series ends Aug 31.
Model: SFINCS (Deltares), set up with HydroMT-SFINCS. Data: USGS STN high-water marks and NWIS gauges, NOAA CO-OPS tide gauges, NOAA CUDEM, USGS 3DEP, ESA WorldCover, NOAA MRMS rainfall, Census TIGER/Line city limits, and my own SCHISM-WWM Harvey simulation.
Related: the same event’s wave and surge hindcast in the ADCIRC-SWAN vs. SCHISM-WWM intercomparison, and the Compound Flood Modeling (SFINCS) product page.