Independent Projects
Self-directed technical work outside client engagements and peer review — models, tools, and methods explored on my own initiative, documented the same way as everything else here: problem, approach, result.
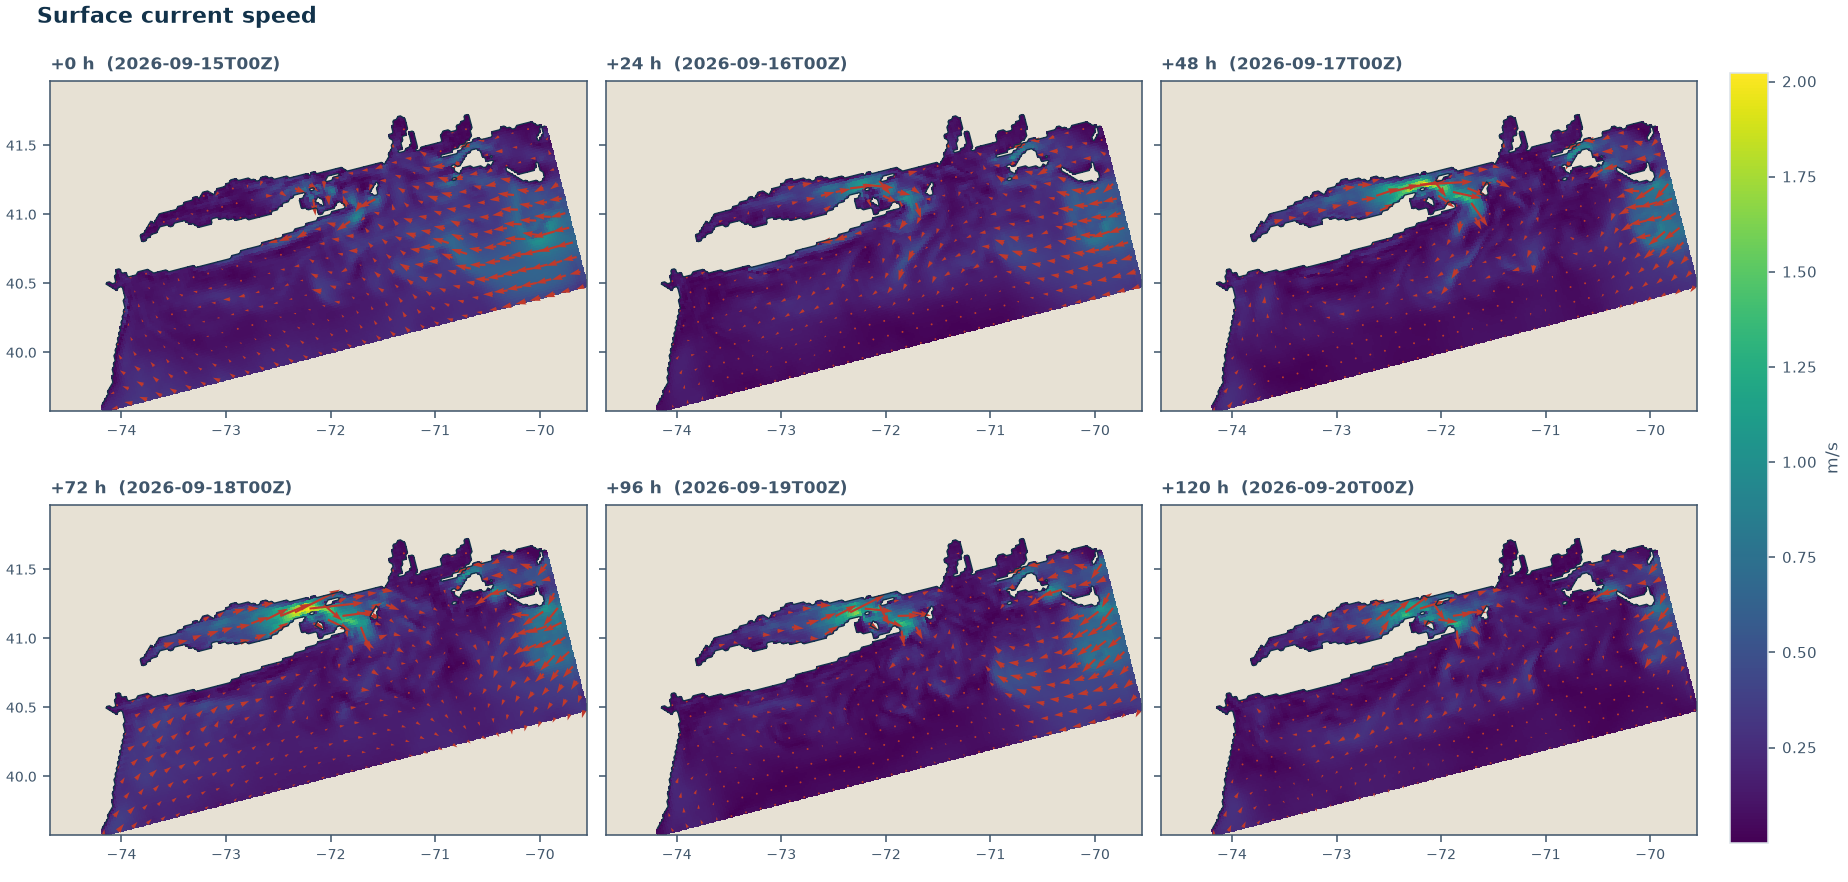
Regional Operational Ocean Forecast for New York Bight
A self-operated ROMS regional ocean forecast system for the New York Bight, running a daily 5-day forecast cycle for surface currents, water level, temperature, and salinity, with skill checked against NOAA tide gauges.
The system runs a daily operational cycle whose water-level forecasts track the CO-OPS tide gauge record closely — correlation of 0.95 at Sandy Hook and 0.90 at Montauk — with comparable current skill (R of 0.88-0.89 against an NDBC buoy at Barnegat, NJ) and more mixed sea-surface temperature skill (R of 0.12-0.65 across five stations), tracked daily in the report below.
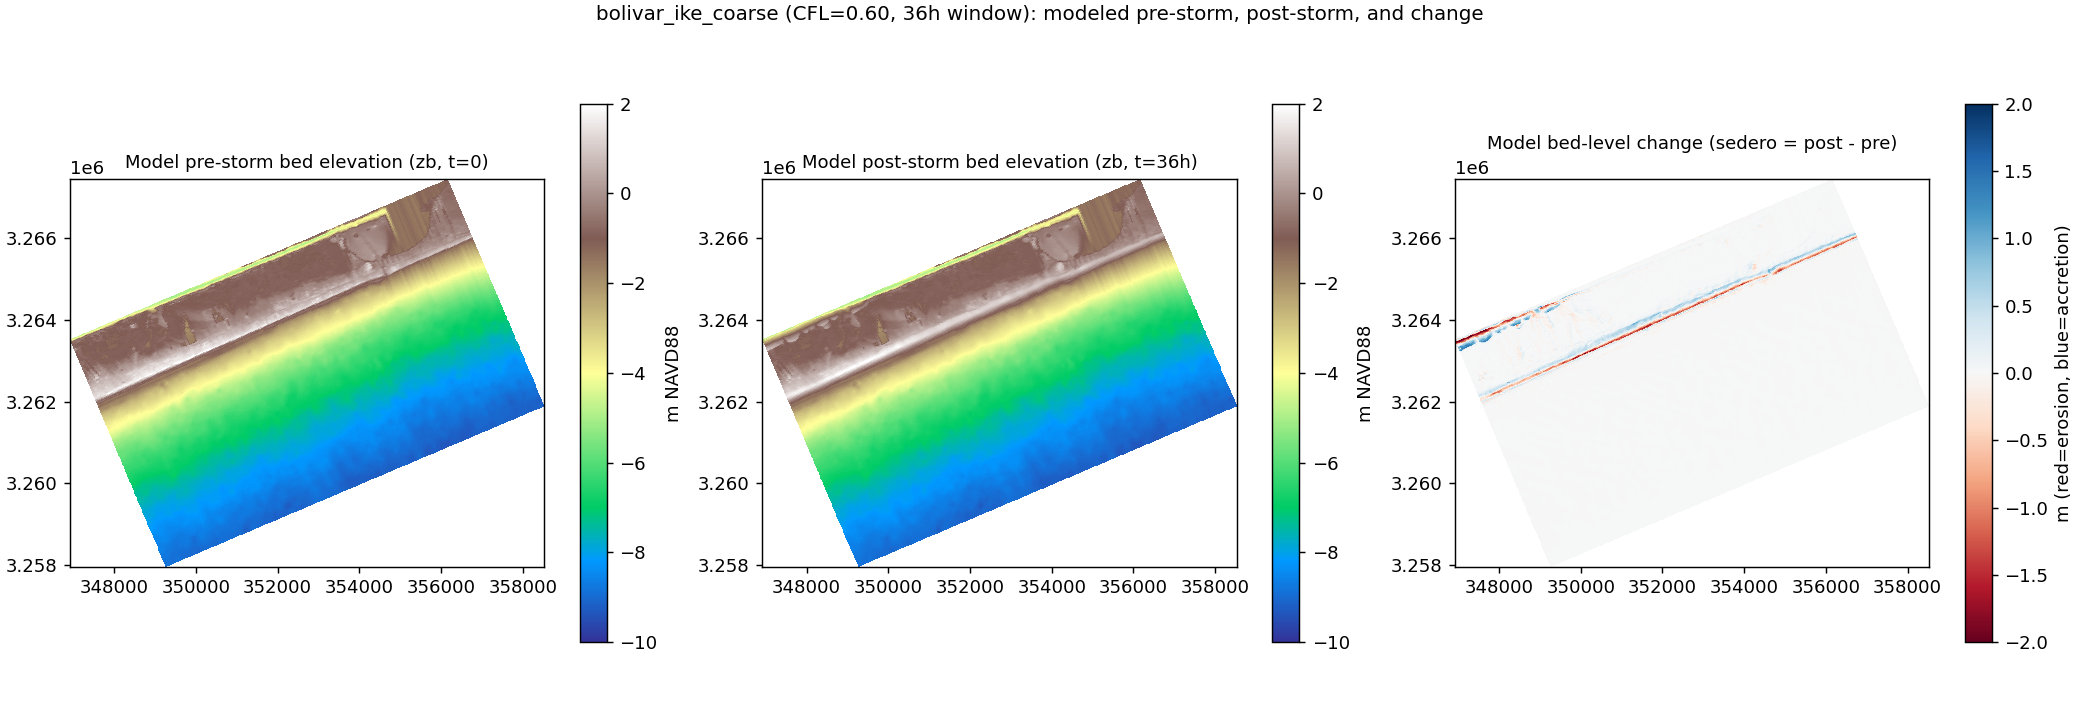
Hurricane Ike Beach and Dune Erosion Modeling on Bolivar Peninsula (XBeach)
A physics-based storm-impact model of the Bolivar Peninsula barrier breach that Hurricane Ike reshaped in 2008, built from a real regional storm hindcast and checked against airborne pre- and post-storm lidar.
The model reproduced the beachface erosion response well (correlation ~0.7 against the lidar record for erosion specifically) and, just as usefully, surfaced a genuine physical limitation of this class of model: it can’t reproduce the slower, wind-driven dune rebuilding that lidar shows occurred between storms – a clear, evidence-based line between what the model can and can’t do.
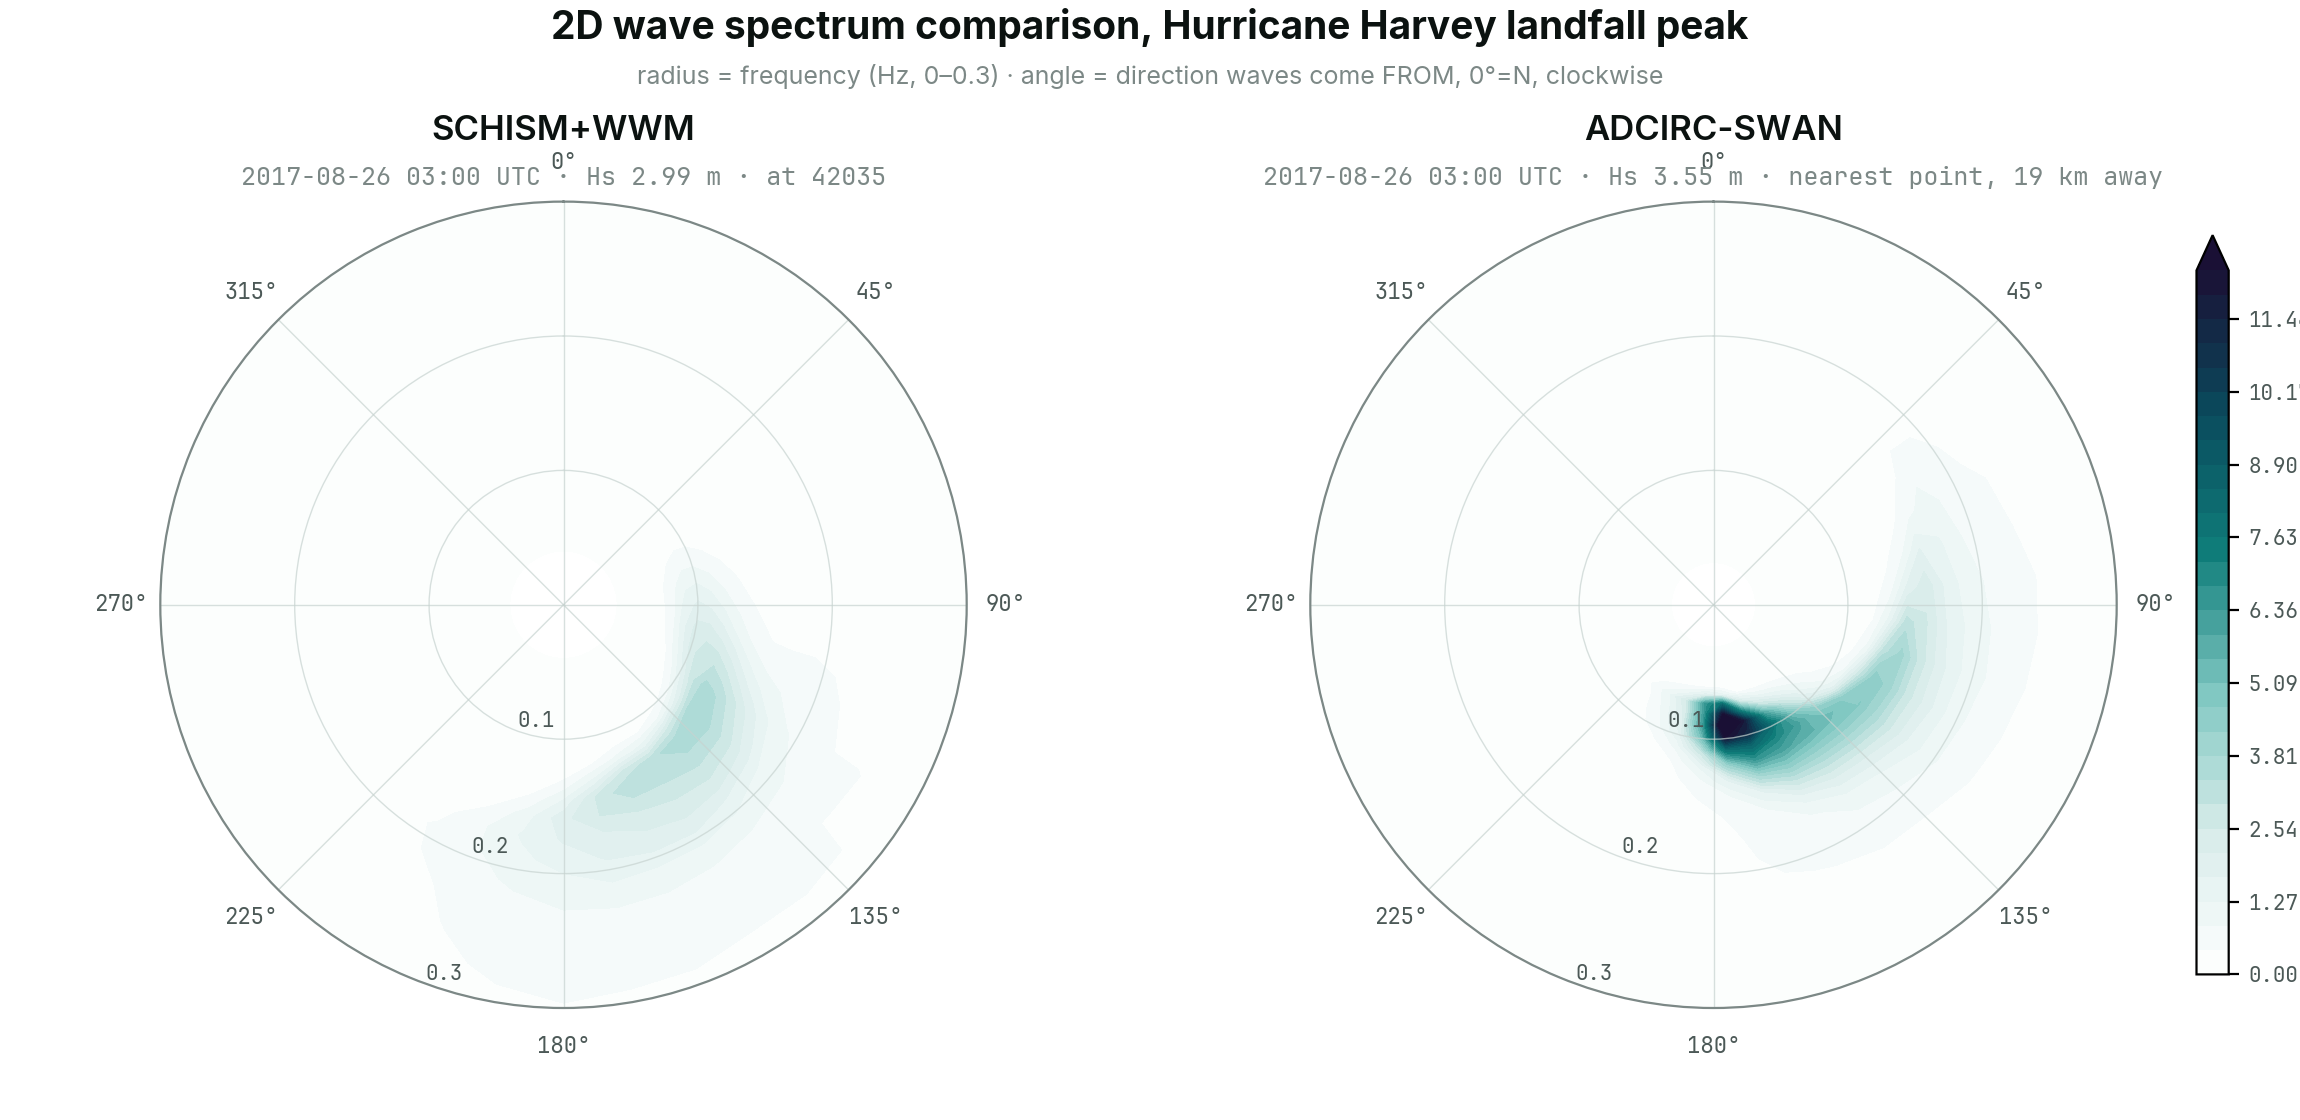
Coupled Wave-Surge Model Inter-comparison: Hurricane Harvey (ADCIRC-SWAN vs. SCHISM-WWM)
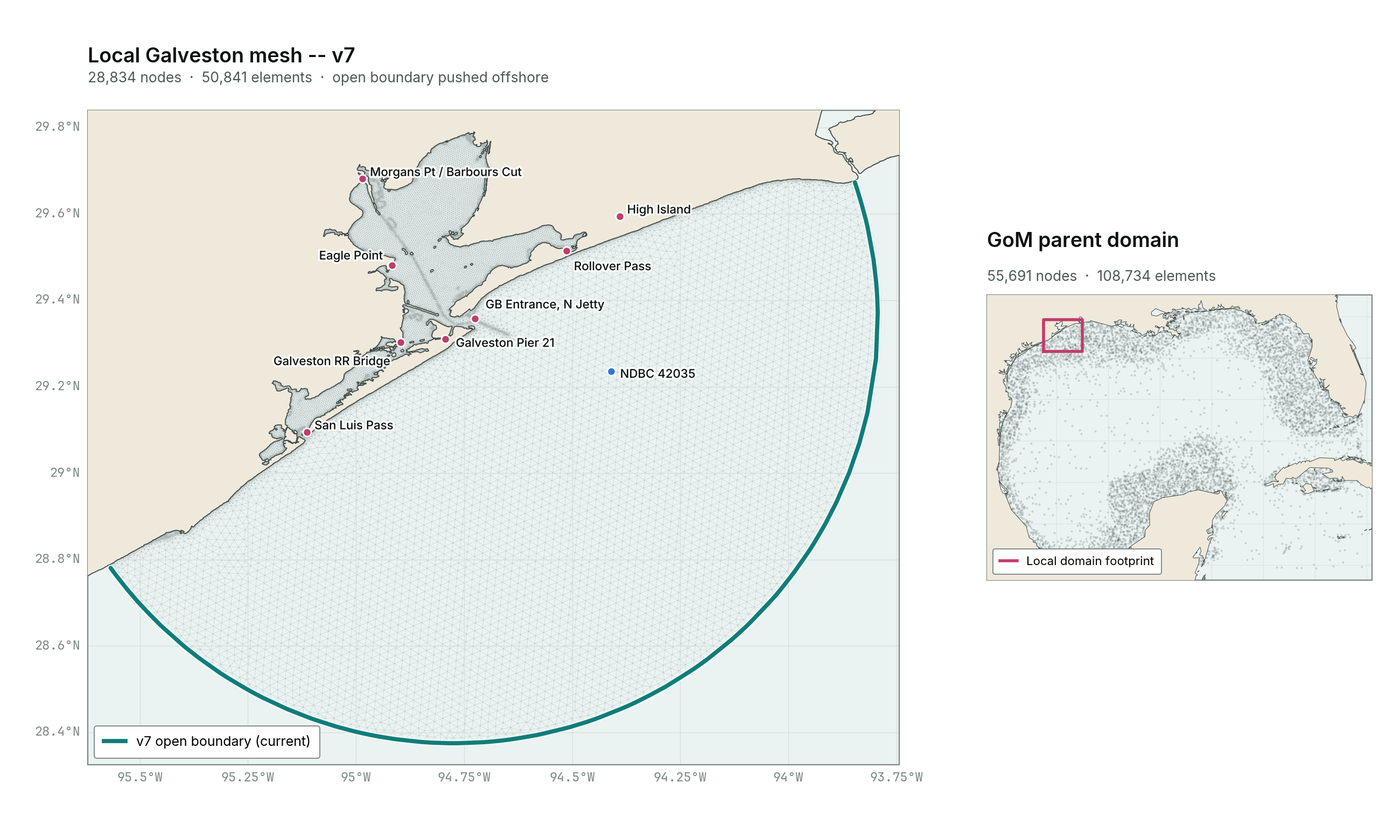
Comparing coupled ADCIRC-SWAN and SCHISM-WWM storm surge and wave models for the Galveston, Texas coast, nested from a Gulf of Mexico regional domain, against Hurricane Harvey (2017).
At the regional Gulf-of-Mexico scale, SCHISM-WWM matched observed wave heights better than ADCIRC-SWAN and finished in roughly a third of the total compute. At the local Galveston scale, SCHISM-WWM reproduced roughly 70–90% of the observed storm-surge rise at the five open-coast and inlet gauges (correlation 0.68–0.89) and ADCIRC-SWAN roughly 30–45% (correlation 0.57–0.83). Local current speed is only about a third of the observed depth-averaged value: about half on tide-only days, and much less during the storm because the run has no river or rainfall inflow to drive the sustained outflow the current meter recorded. Two bay-interior gauges also don’t respond in the model at all — all documented below as open problems.
Coupled Wave-Surge Model Validation: Hurricane Ike (SCHISM-WWM)
A nested Gulf-of-Mexico-to-Galveston SCHISM-WWM hindcast of Hurricane Ike (2008): wave, wind, current, and datum-corrected storm-surge validation at Gulf buoys and Galveston gauges, a wind-forcing bug whose fix repaired the storm’s structure but not its intensity, and an offshore-boundary fix that recovered lost wave energy.
Found a real wind-forcing bug (a safety cap tuned for Harvey applied to a very different storm), then, separately, integrated a better GAHM+ERA5 wind blend shared with this project’s SWAN/WW3 workflows and relaunched first the local Galveston domain, then the Gulf-of-Mexico parent domain, with it. The new wind cuts peak-wind RMSE by about 40% at buoy 42035 (53 → 34 m/s vs. 27.9 m/s observed) and by about the same at the nearest Gulf buoy, 42001 (peak 52 → 35 m/s vs. 30 m/s observed); every other Gulf buoy is essentially unchanged, since the refit only bites near the storm core. Local wave height still correlates well with observations (r=0.89), but storm surge got worse, not better: with the old, overly strong wind the model reached 88% of the recorded peak at Galveston Pier 21; with the corrected, weaker wind it reaches 66%, and every one of five gauges moved further from its observed peak. The old wind’s overestimate had been silently compensating for a separate surge shortfall — fixing one bug exposed another. In deep water the better wind helped only partly: Hs at 42001 fell from 40% too high to 30% too high despite the local wind’s peak dropping by a third, and 42002’s waves, whose local wind barely changed, stayed just as high. The 2D barotropic model cannot reproduce the observed deep-water current at 42002 either way. Tidal current at the Galveston Bay Entrance is still only about half of NOAA’s predicted speed — the same shortfall found for Harvey, on a different mesh.
Wave Model Grid Comparison: Hurricane Harvey (WW3 to SWAN, Structured vs. Unstructured)
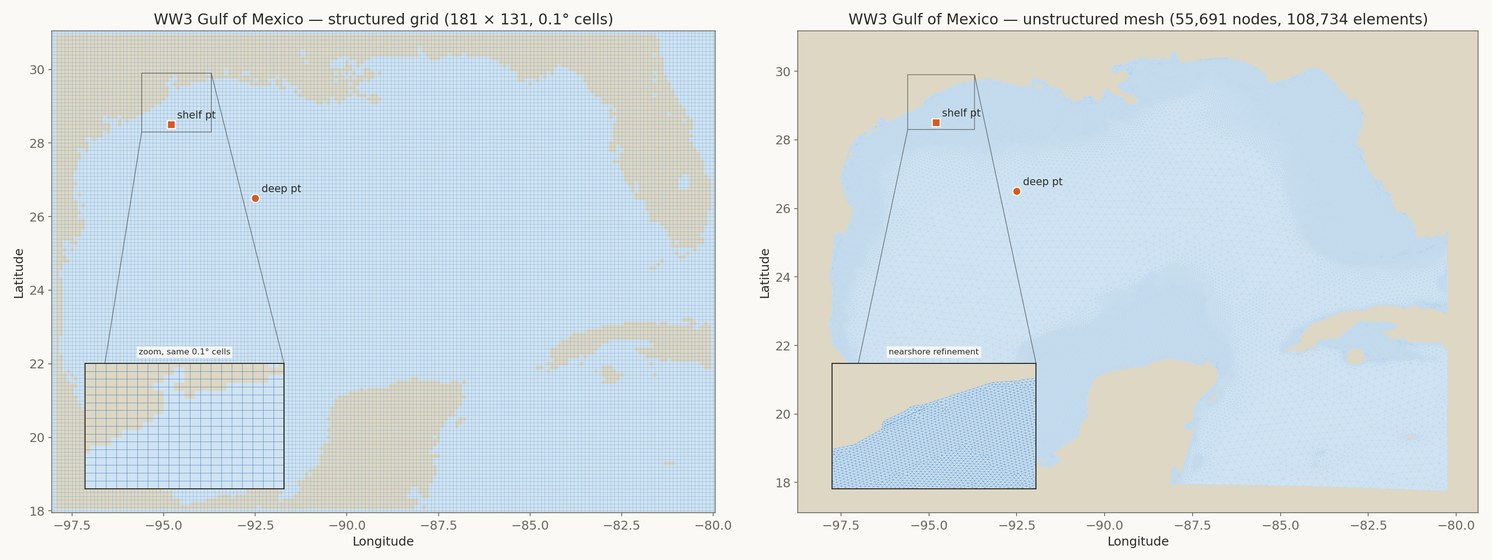
A regional WAVEWATCH III model of the Gulf of Mexico run on a structured grid and on an unstructured mesh, each nested into a local SWAN model of Galveston, for Hurricane Harvey and checked against NDBC buoys for wave height, period, direction and wind.
The two grids agree within 3.8% on peak wave height in deep water and 2.5% at the Galveston harbor entrance, and both follow the buoys closely (wave-height correlation 0.79 to 0.98). The structured run took 44 minutes and the unstructured run 176 minutes, 4.0 times longer. The comparison also exposed a depth sign-convention error that had silently marked about 98% of the unstructured mesh as dry, which made it under-predict waves by a factor of 5 to 6 until it was fixed.
Wave Model Grid Comparison: Hurricane Ike (WW3 to SWAN, Structured vs. Unstructured)
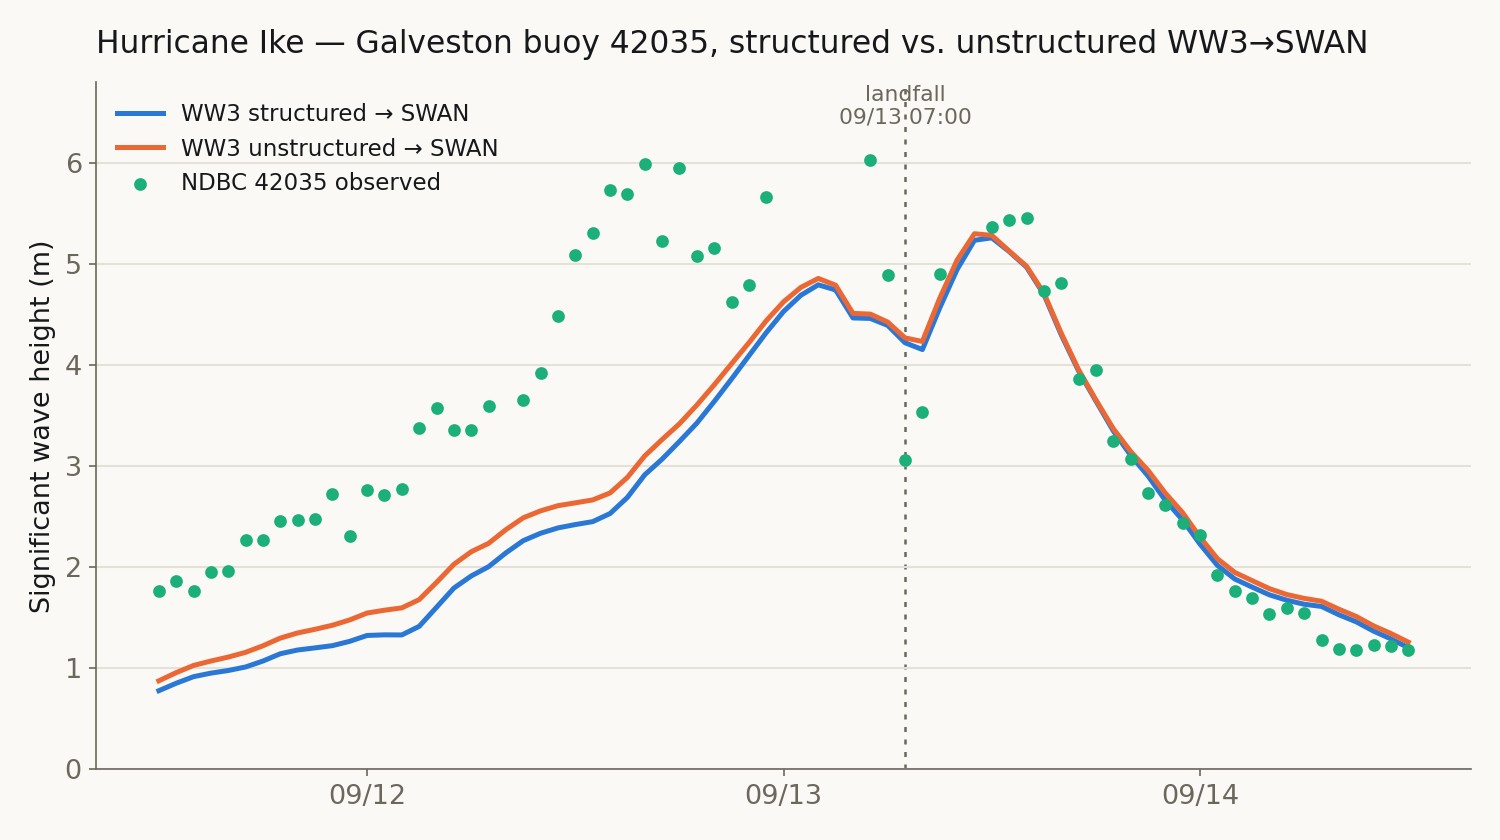
A regional WAVEWATCH III model of the Gulf of Mexico run on a structured grid and on an unstructured mesh, each nested into a local SWAN model of Galveston, for Hurricane Ike (2008) and checked against NDBC buoys — including a diagnosis and partial fix of a Galveston under-prediction that turned out to be a bottom-friction and nest-numerics issue, not a grid-resolution one.
Surge/currents and swell dissipation made no difference. Two real, additive causes were found: WW3’s default bottom friction was too strong for this shelf (switching to SWAN’s own default value fixed about 30% of the pre-landfall deficit, and helped every other Gulf buoy too), and the SWAN nest’s default time step was too coarse for its propagation scheme. Combined, Galveston’s RMSE improved from 1.64 m to 1.21–1.33 m and its landfall peak from 4.50 m to 5.26–5.30 m against 6.03 m observed. A standalone single-domain SWAN run reached 0.70 m RMSE at the same buoy under the same wind, showing a real, unexplained WW3-vs-SWAN physics difference remains — documented rather than chased further. Both fixes are now the pipeline default for this storm.
Compound Flood Simulation of Hurricane Harvey in Houston-Galveston (SFINCS)
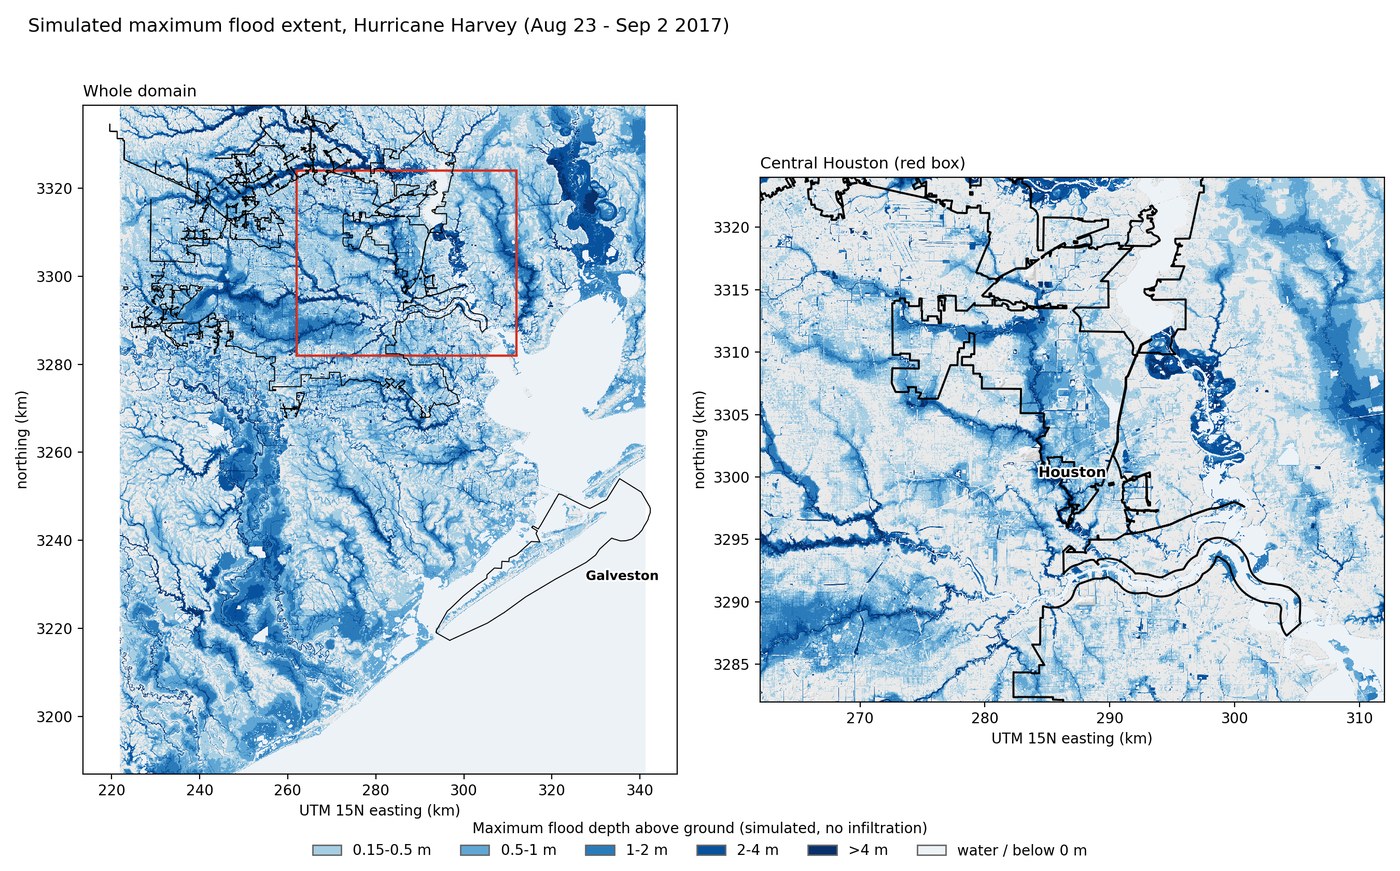
A 10-day SFINCS compound-flood simulation of Hurricane Harvey over Houston and Galveston Bay, forced by real rainfall, a coastal-surge boundary from my own SCHISM-WWM hindcast and river discharge, and checked against 838 high-water marks, tide stations and stream gauges.
Peak water levels at the 838 true high-water marks have a bias of +0.28 m (RMSE 1.87 m), and the three NOAA tide stations agree within 0.32 m. The validation also exposed two things worth knowing: 114 apparent marks along Buffalo Bayou were surveyed a week or more after the peak and are not comparable, and the model has no infiltration, so it runs about 2 m high along Buffalo and Whiteoak Bayous and its flood extent is an upper bound.